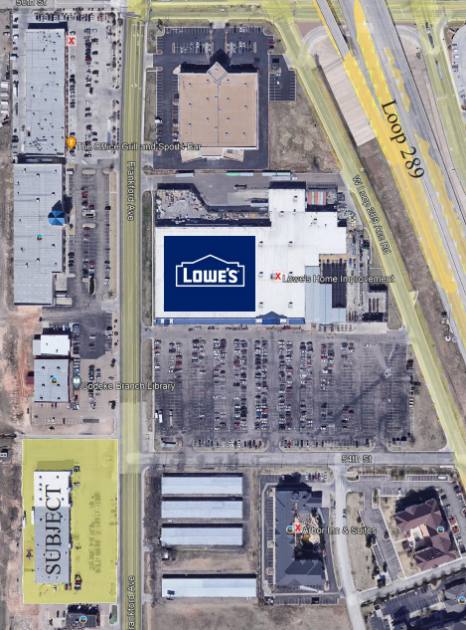
1-Mile | 3-Miles | 5-Miles | ||
---|---|---|---|---|
Total Population | 10,313 | 90,141 | 201,153 | |
Population Median Age | 35 | 36 | 35 | |
Population by Age | 0-9 Yrs | 1169 (11%) | 11489 (12%) | 25657 (12%) |
10-19 Yrs | 904 (8%) | 10794 (11%) | 30576 (15%) | |
20-29 Yrs | 3133 (30%) | 19487 (21%) | 44032 (21%) | |
30-39 Yrs | 1708 (16%) | 12107 (13%) | 26387 (13%) | |
40-49 Yrs | 833 (8%) | 9135 (10%) | 20114 (9%) | |
50-59 Yrs | 879 (8%) | 9632 (10%) | 19305 (9%) | |
60-69 Yrs | 808 (7%) | 8785 (9%) | 18177 (9%) | |
70+ Yrs | 879 (8%) | 8713 (9%) | 16905 (8%) | |
Median HH Income | $42,677 | $57,884 | $57,443 | |
Total Household Income | < 24K | 1737 (32%) | 8195 (21%) | 16293 (20%) |
25-49K | 1379 (25%) | 8435 (22%) | 18222 (23%) | |
50-74K | 1059 (19%) | 6841 (18%) | 13778 (17%) | |
75-99K | 531 (9%) | 5263 (13%) | 9938 (12%) | |
100-199K | 571 (10%) | 7399 (19%) | 15768 (20%) | |
200K+ | 44 (0%) | 1711 (4%) | 4002 (5%) | |
Highest Education Level | No Diploma | 433 | 4337 | 10687 |
Diploma or GED | 1512 | 12717 | 26461 | |
Some College | 1857 | 13745 | 27670 | |
Assoc. Degree | 525 | 4136 | 8263 | |
Bachelors Degree | 1349 | 13885 | 28110 | |
Higher Degree | 760 | 7759 | 17003 | |
Total Housing Units | 6,085 | 41,103 | 85,000 | |
--Owner-Occupied | 1,232 | 19,625 | 42,085 | |
--Renter-Occupied | 4,089 | 18,217 | 35,916 | |
Owner-Occupied Values | < 100K | 520 | 3397 | 7527 |
100-199K | 499 | 10145 | 20508 | |
200-299K | 153 | 3487 | 7868 | |
300-399K | 29 | 1377 | 3272 | |
400-499K | 12 | 529 | 1353 | |
500K+ | 18 | 690 | 1556 | |
Total Working Age Population | 8,657 | 72,014 | 160,160 | |
In Work Force | 6,465 | 50,371 | 106,442 | |
Not In Work Force | 2,192 | 21,643 | 53,718 | |
Workforce Employed | 6,142 | 48,359 | 101,841 | |
Workforce Unemployed | 314 | 1,946 | 4,393 | |
Civlian Workforce | 6,456 | 50,305 | 106,234 | |
Military Workforce | 10 | 66 | 208 | |
Total Households | 5,321 | 37,842 | 78,001 | |
Family Households | 2,097 | 21,251 | 45,147 | |
Non-Family Households | 3,224 | 16,591 | 32,854 | |
Married Couple | 1,202 | 15,294 | 32,736 | |
Other Family | 895 | 5,957 | 12,411 | |
Married w/Child | 434 | 5,893 | 13,616 | |
Single Male w/Child | 66 | 650 | 1,380 | |
Single Female w/Child | 475 | 2,658 | 5,009 |
Population Change Last Two Decades - Plus Projection
2000 | % | 2010 | % | 2020 | % | 2030 | |
---|---|---|---|---|---|---|---|
Texas | 20,851,820 | +21 | 25,145,561 | +18 | 29,677,668 | +18 | 34,894,452 |
Lubbock County | 242,628 | +15 | 278,831 | +14 | 317,210 | +16 | 367,552 |
Total Working Age Population:
Total Households:
Total Working Age Population:
Total Households:
Total Working Age Population:
Total Households: