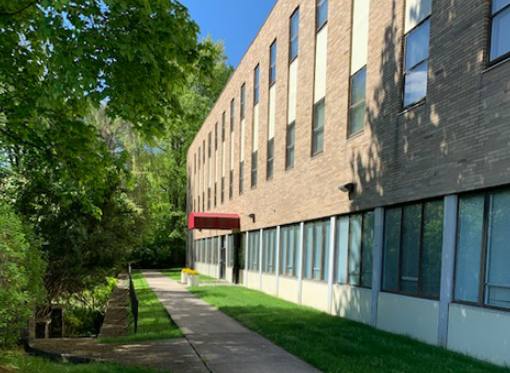
Flex-Office-Warehouse
1 Campus Drive Pleasantville, NY 10570
1 Campus Drive Pleasantville, NY 10570
Details & Description
Property Highlights
- • 3 story office/flex building
- • 270 surface parking spaces
- • Minutes to Pleasantville Train Station
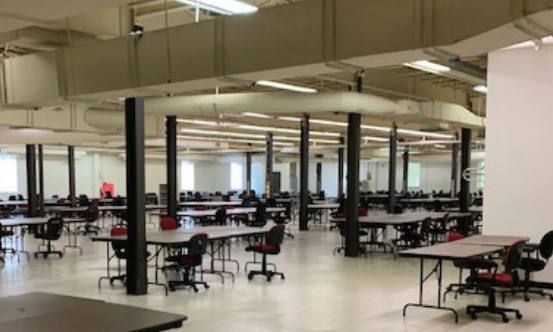
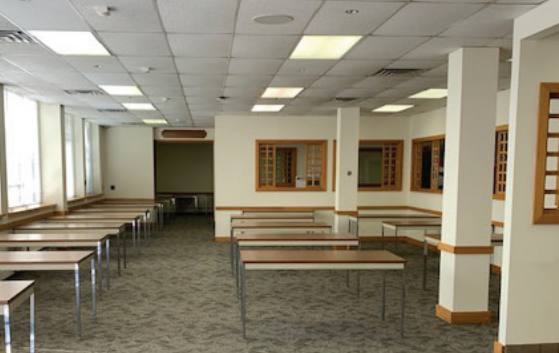
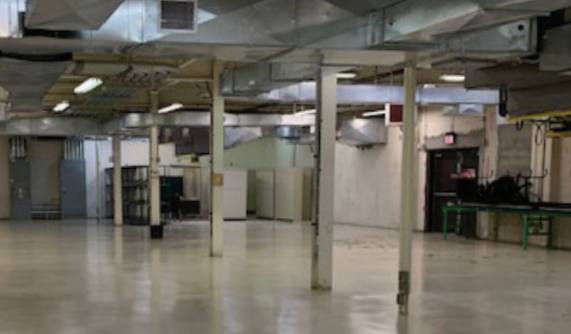
Additional Photos
Listing Agents

John Barrett
O: 914-361-4467
M: 646-678-1153
jbarrett@rmfriedland.com
O: 914-361-4467
M: 646-678-1153
jbarrett@rmfriedland.com

Chris O'Callaghan
O: 914-278-6466
M: 914-325-1597
cocallaghan@rmfriedland.com
O: 914-278-6466
M: 914-325-1597
cocallaghan@rmfriedland.com
While we strive to provide the most accurate information, all listing information, and demographic data, is provided by third-parties. As such, MyEListing will not be responsible for the accuracy of the information. It is strongly recommended that you verify all information with the listing agent, and any relevant agencies, prior to making any decisions.


