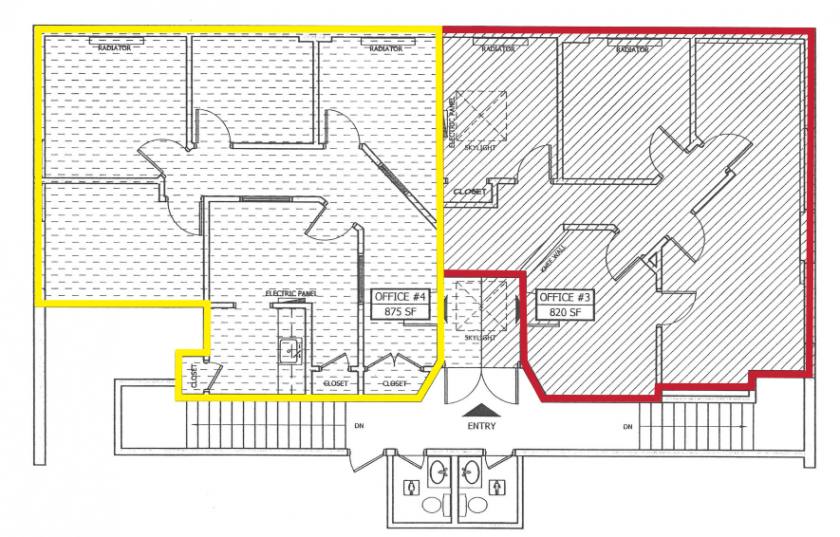
Office Space
18 Purdy Avenue Rye, NY 10580
18 Purdy Avenue Rye, NY 10580
Details & Description
Property Highlights
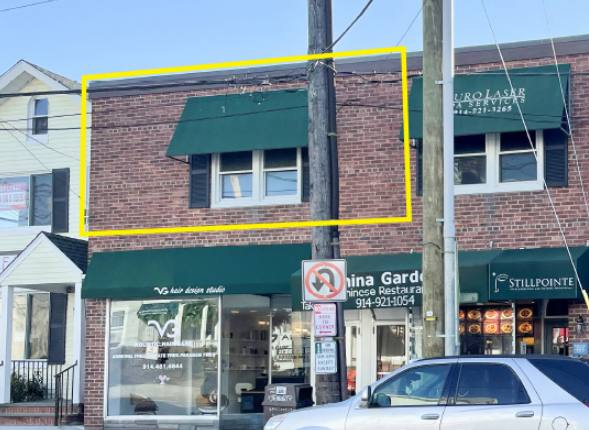
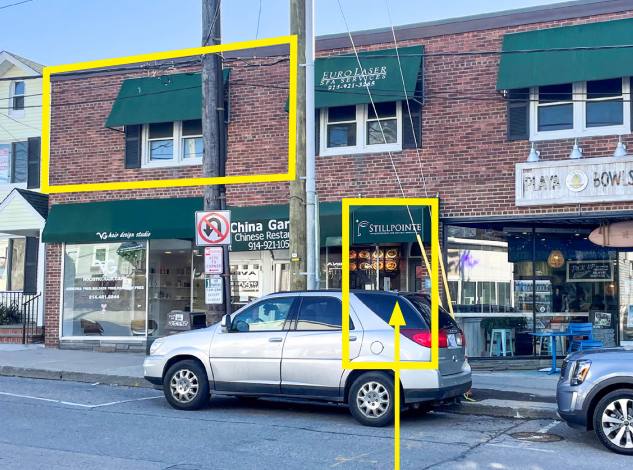
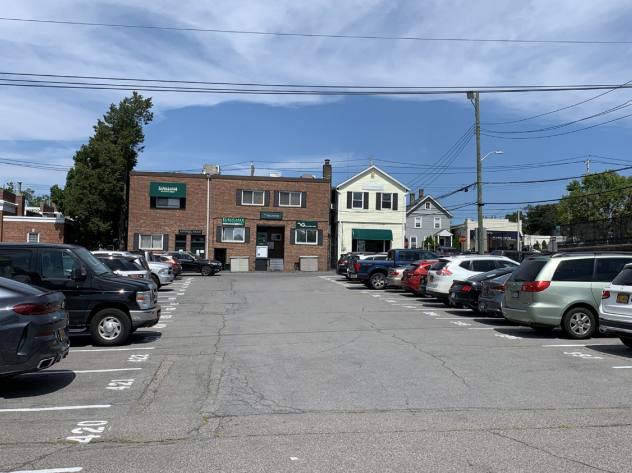
- • Potential signage facing Purdy Ave
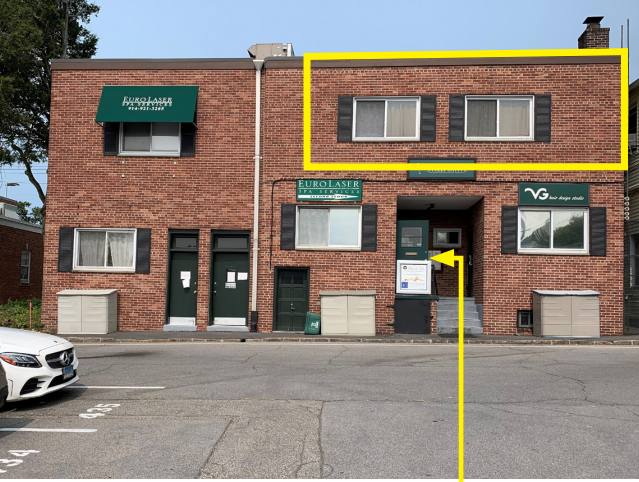
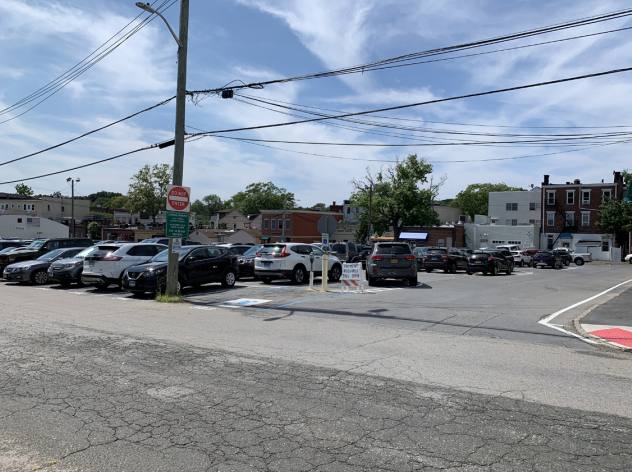
- • Adjacent to municipal parking lot
- • Walking distance to the Rye train station
- • Numerous restaurants and retail nearby
- • Additional entrance from parking lot
- • 5,100 cars per day on Purdy Ave
Additional Photos
Listing Agents

David Scotto
O: 914-363-7904
M: 914-582-0000
dscotto@rmfriedland.com
O: 914-363-7904
M: 914-582-0000
dscotto@rmfriedland.com
While we strive to provide the most accurate information, all listing information, and demographic data, is provided by third-parties. As such, MyEListing will not be responsible for the accuracy of the information. It is strongly recommended that you verify all information with the listing agent, and any relevant agencies, prior to making any decisions.