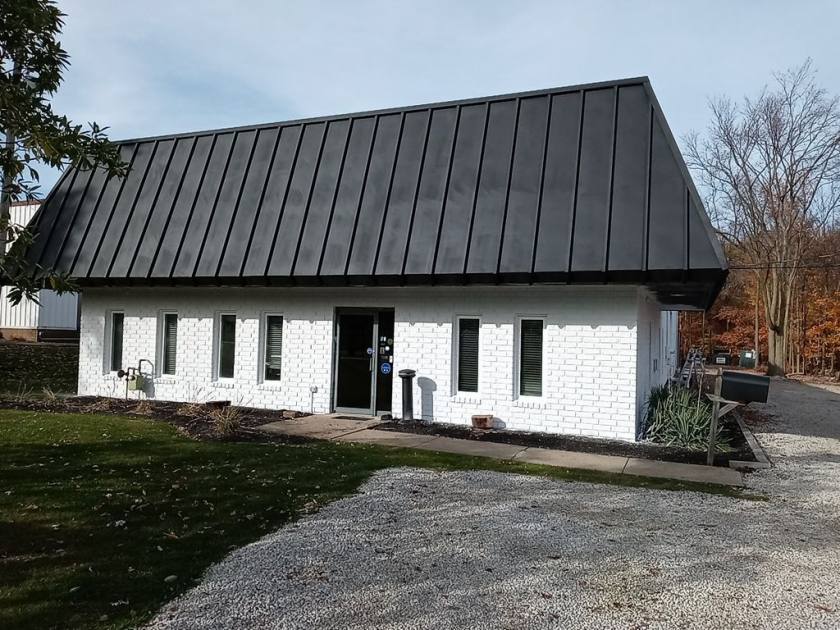
Flex-Office-Warehouse
2077 Midway Drive Twinsburg, OH 44087
2077 Midway Drive Twinsburg, OH 44087

Details & Description
Property Highlights
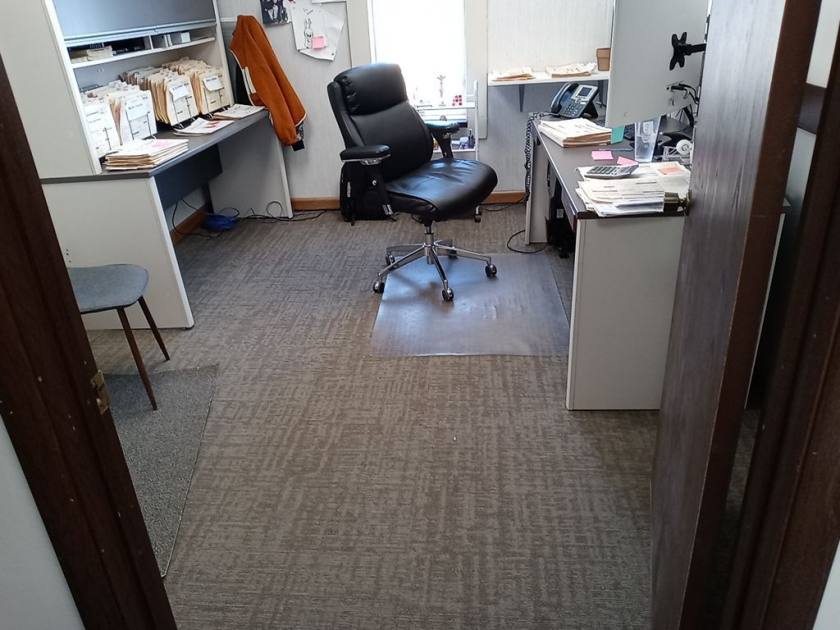
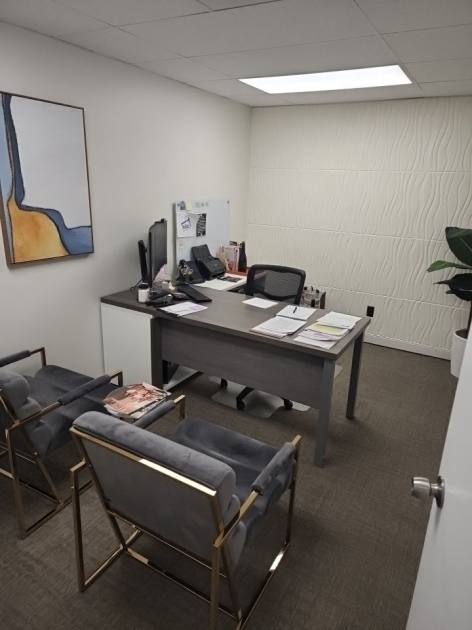
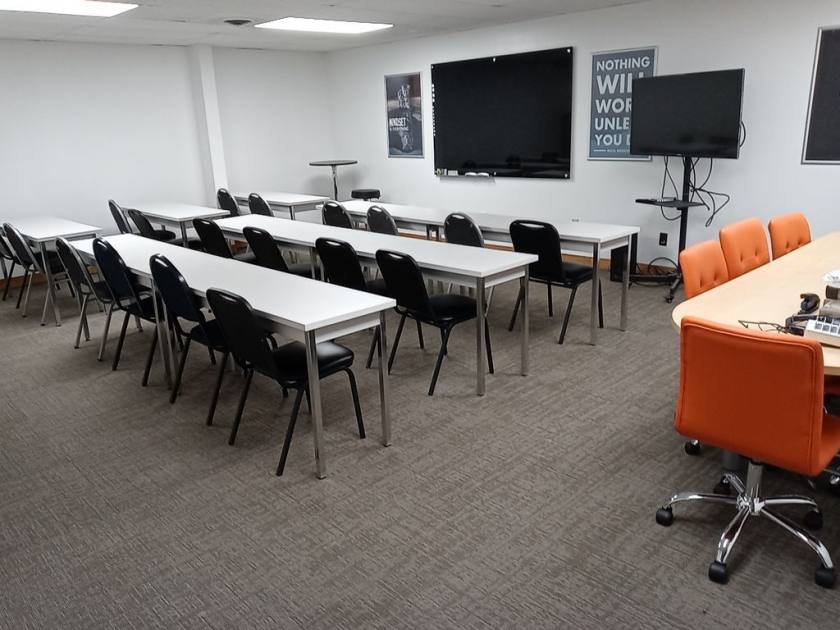
- • 3,612 SF office
- • 2,924 SF warehouse
- • 2 drive-in doors
- • 16' clear
- • Potential expansion
- • Major renovations in 2015-2016
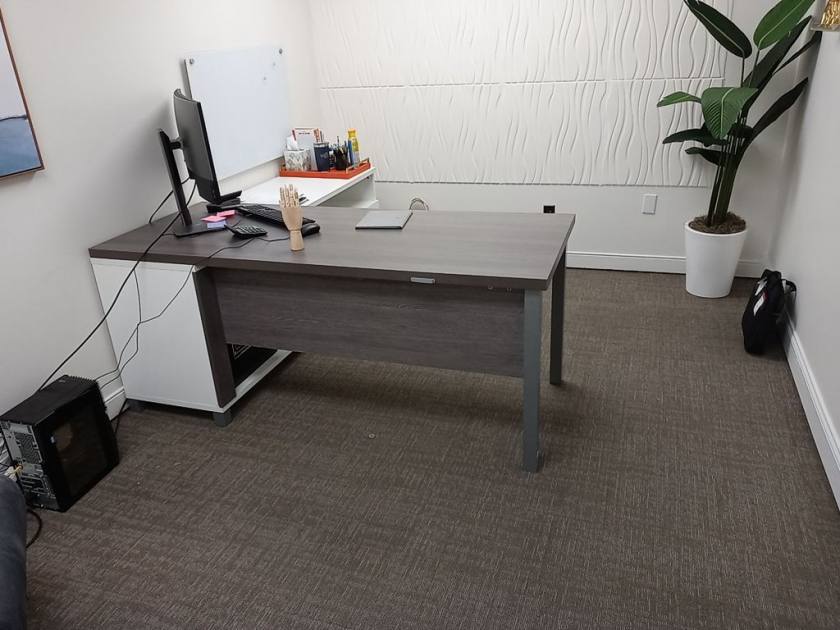
Additional Photos

Listing Agents

Ron Midcap II
O: 216-455-0900
M: 330-671-7767
rmidcap@naipvc.com
O: 216-455-0900
M: 330-671-7767
rmidcap@naipvc.com
While we strive to provide the most accurate information, all listing information, and demographic data, is provided by third-parties. As such, MyEListing will not be responsible for the accuracy of the information. It is strongly recommended that you verify all information with the listing agent, and any relevant agencies, prior to making any decisions.