Commercial Land
30550 Farm to Market 2920 Waller, TX 77484
30550 Farm to Market 2920 Waller, TX 77484
Details & Description
Property Highlights
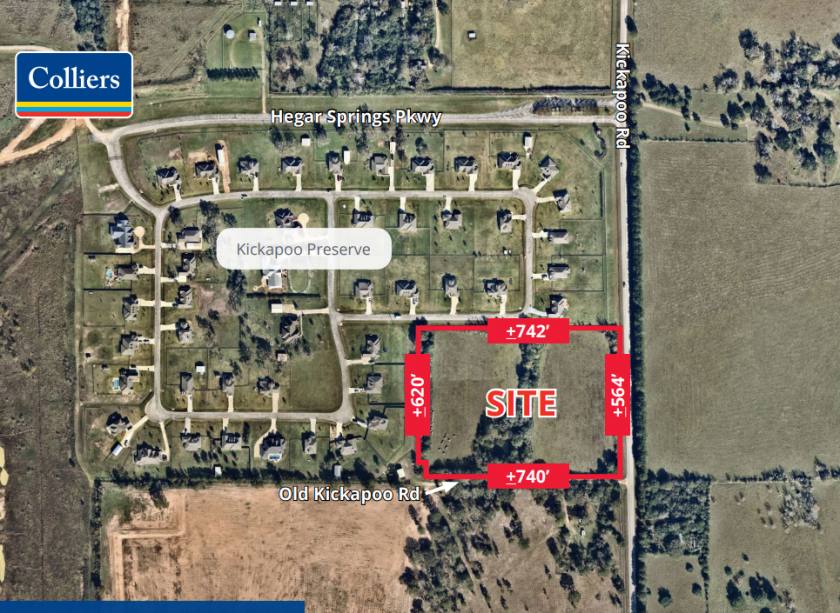
- • + 564’ of frontage on Kickapoo Rd
- • ± 740’ of frontage on Old Kickapoo Rd
- • Outside 100 year floodplain
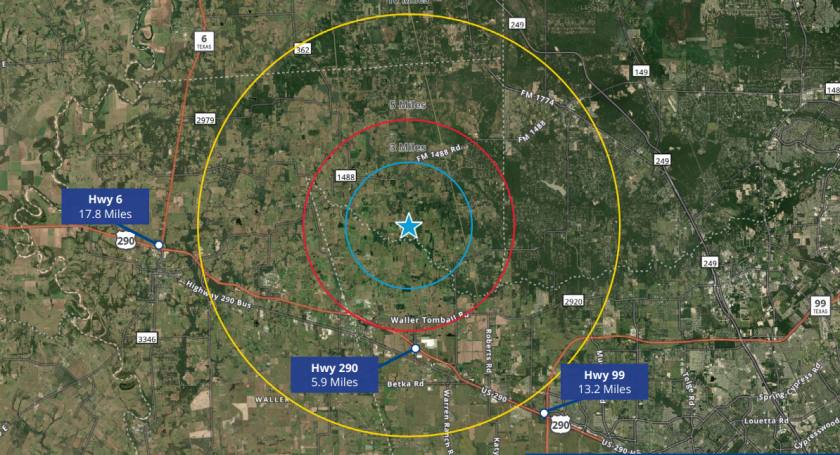
- • 5.9 miles to Highway 290 via Kickapoo Road
- • 3.3 miles south of FM 1488 via Kickapoo Road
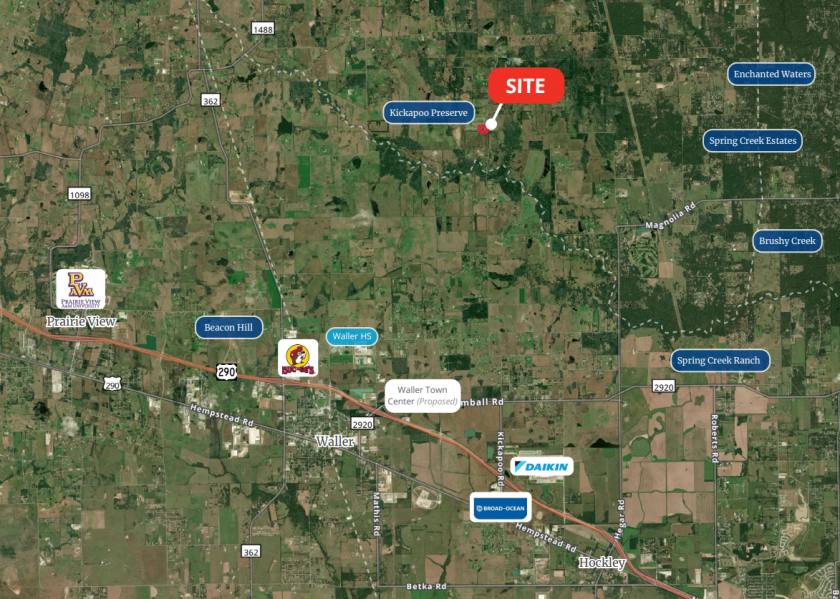
- • Located in Waller County, Waller ISD
Listing Agents

Bill Byrd
O: 713-830-2131
M: 713-628-2022
bill.byrd@colliers.com
O: 713-830-2131
M: 713-628-2022
bill.byrd@colliers.com
While we strive to provide the most accurate information, all listing information, and demographic data, is provided by third-parties. As such, MyEListing will not be responsible for the accuracy of the information. It is strongly recommended that you verify all information with the listing agent, and any relevant agencies, prior to making any decisions.