Office Space
1465 New Jersey 31 Clinton Township, NJ 08801
1465 New Jersey 31 Clinton Township, NJ 08801

Details & Description
Property Highlights
- • Ample parking
- • Elevator
- • Property Manager on Site
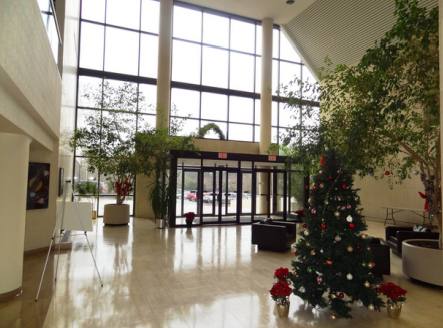
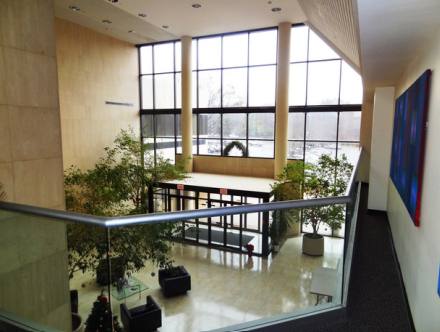
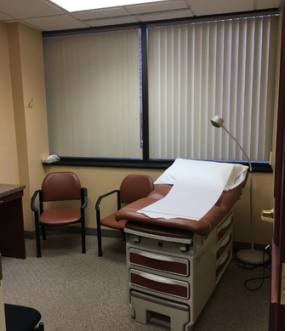
Additional Photos

Listing Agents

Bob Bartnett
O: 908-751-7750
M: 908-528-0577
bobbartnett@kwcommercial.com
O: 908-751-7750
M: 908-528-0577
bobbartnett@kwcommercial.com
While we strive to provide the most accurate information, all listing information, and demographic data, is provided by third-parties. As such, MyEListing will not be responsible for the accuracy of the information. It is strongly recommended that you verify all information with the listing agent, and any relevant agencies, prior to making any decisions.


