Industrial Properties
211 East Alpine, 600 Austin, TX 78704
211 East Alpine, 600 Austin, TX 78704
Details & Description
Property Highlights
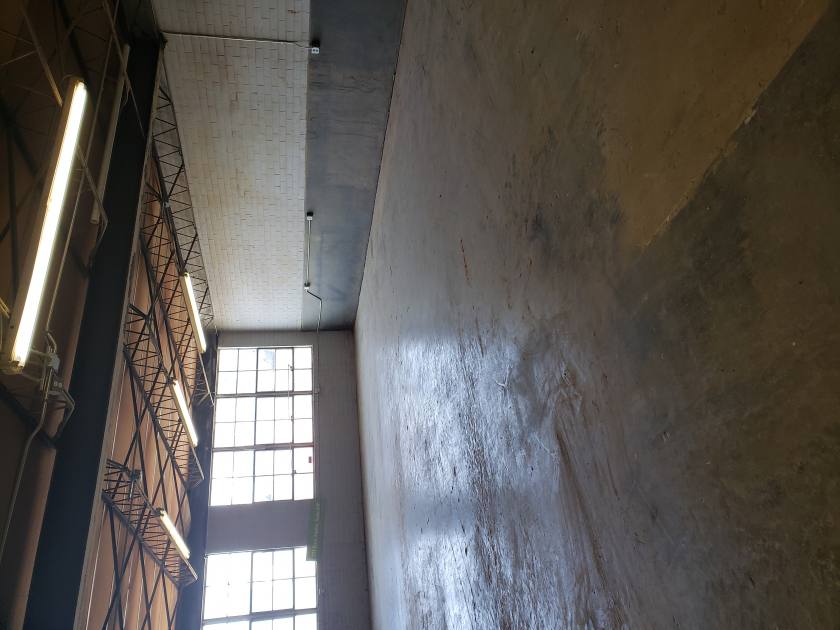
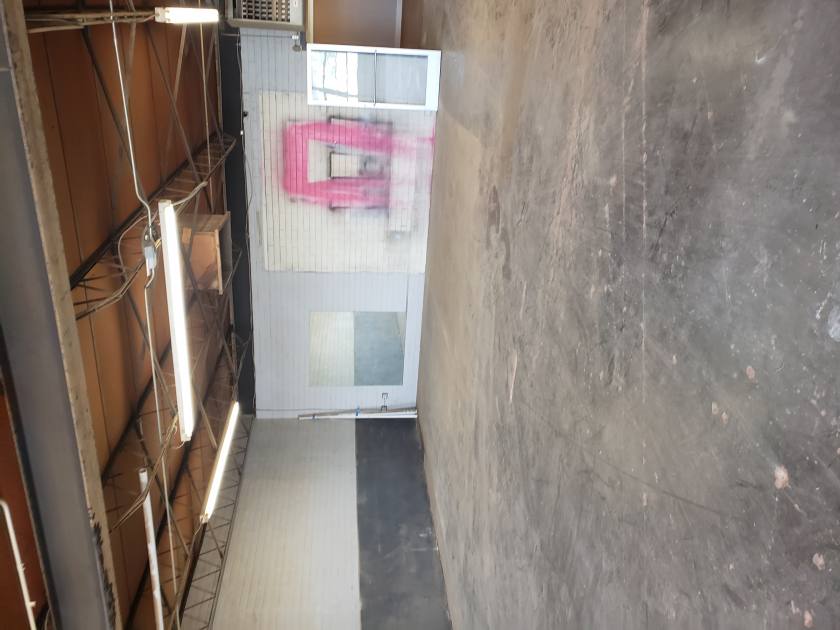
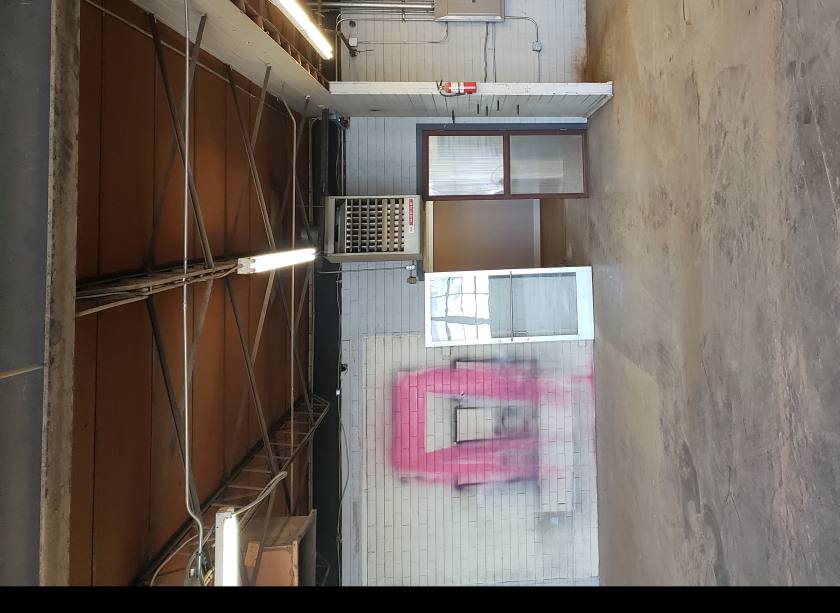
• Large open area with two offices.
• Dock high doors
Listing Agents

Gary Boulden
O: 512-476-1072
gbould@yahoo.com
O: 512-476-1072
gbould@yahoo.com
While we strive to provide the most accurate information, all listing information, and demographic data, is provided by third-parties. As such, MyEListing will not be responsible for the accuracy of the information. It is strongly recommended that you verify all information with the listing agent, and any relevant agencies, prior to making any decisions.