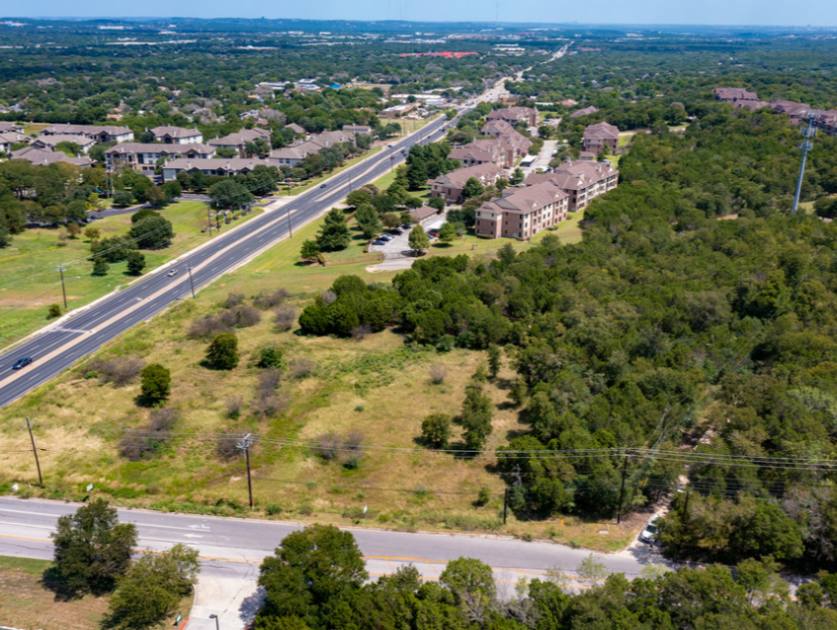
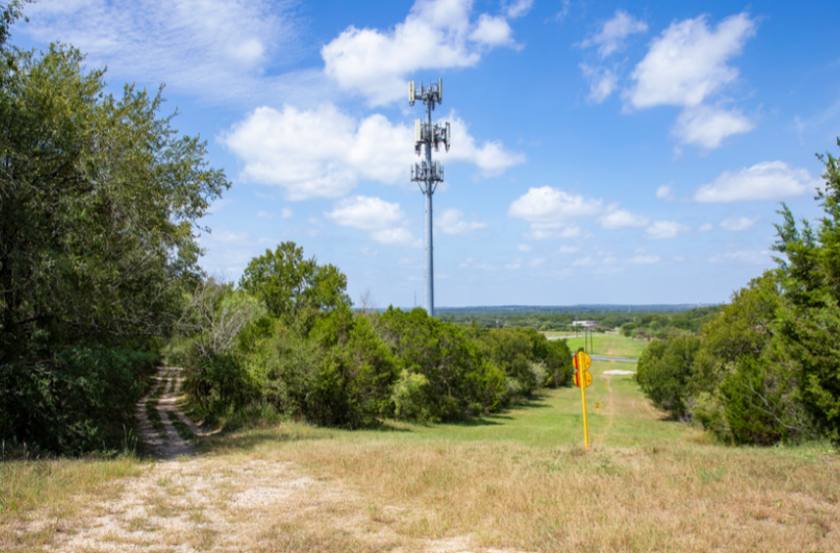
Commercial Land
3416 Davis Lane Austin, TX 78745
3416 Davis Lane Austin, TX 78745
Details & Description
Property Highlights
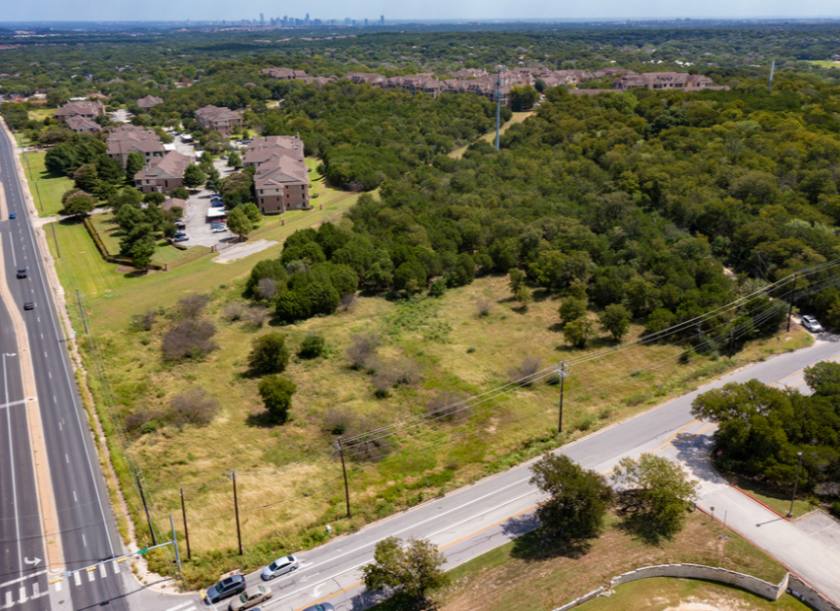
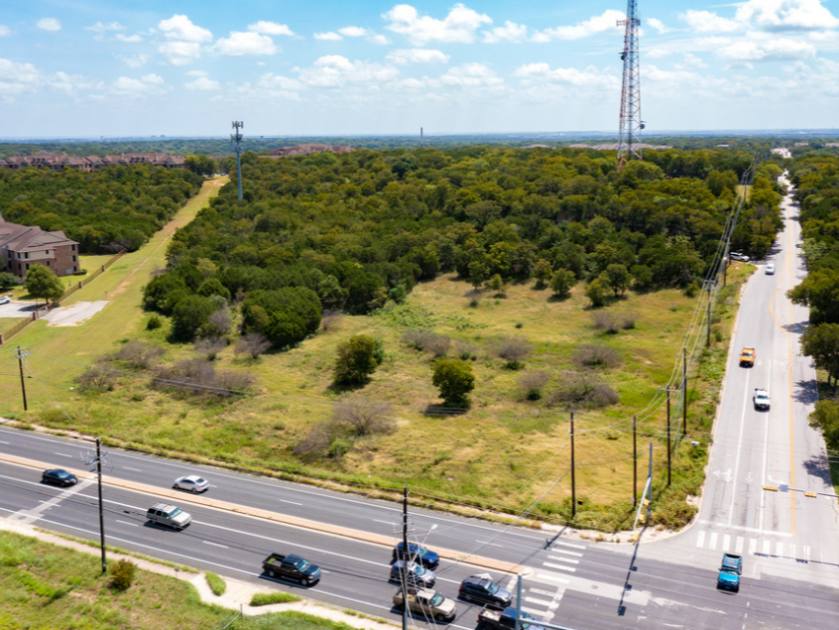
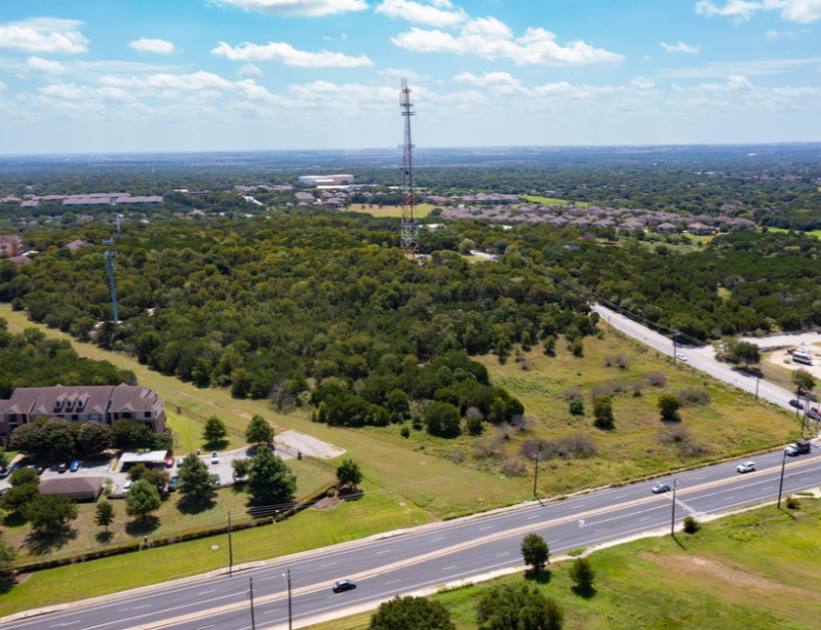
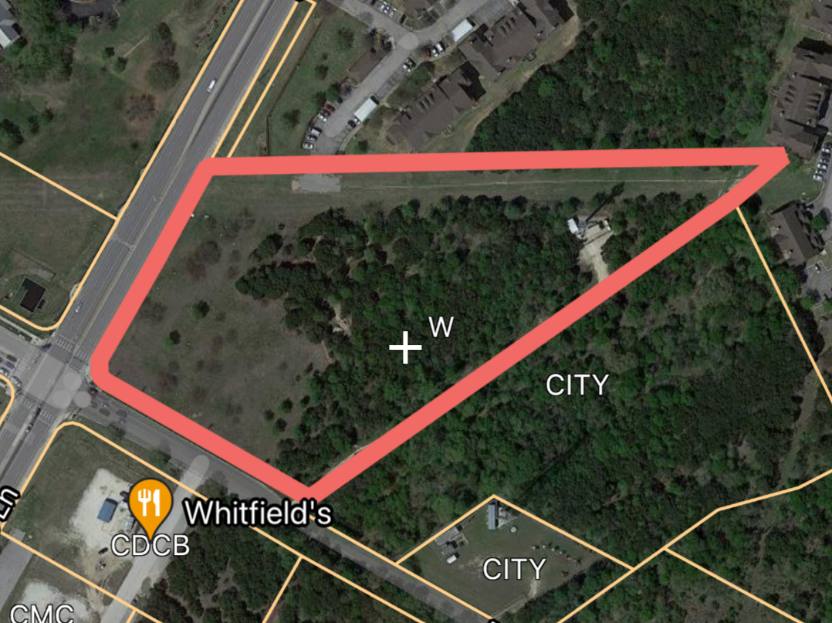
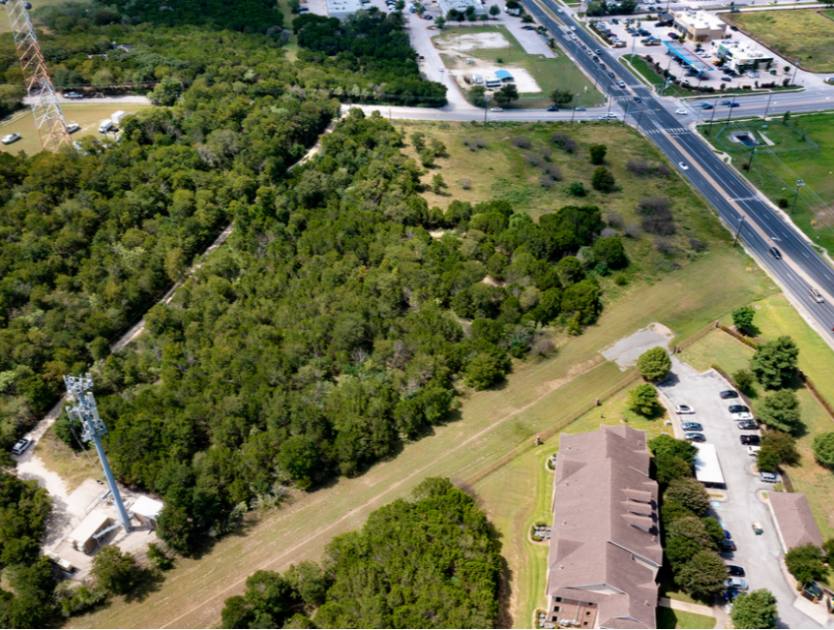
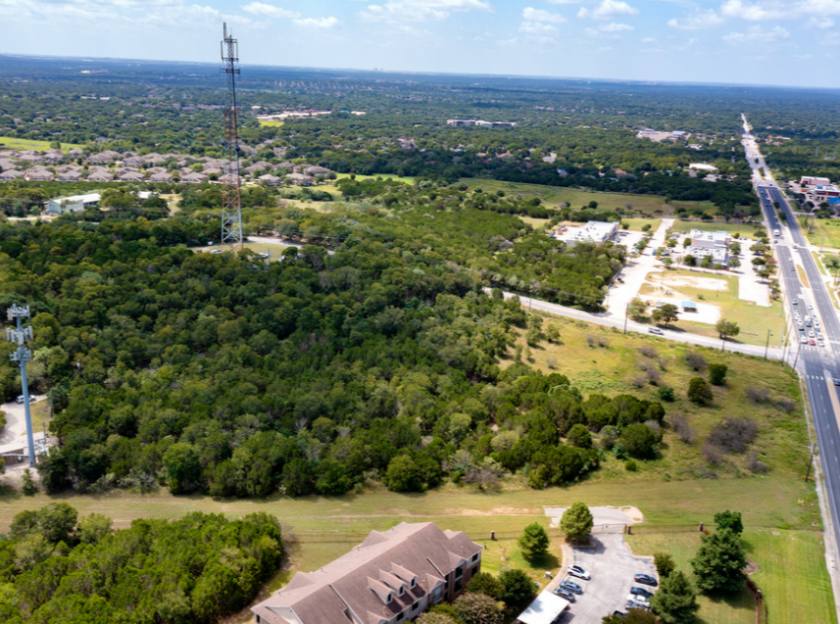
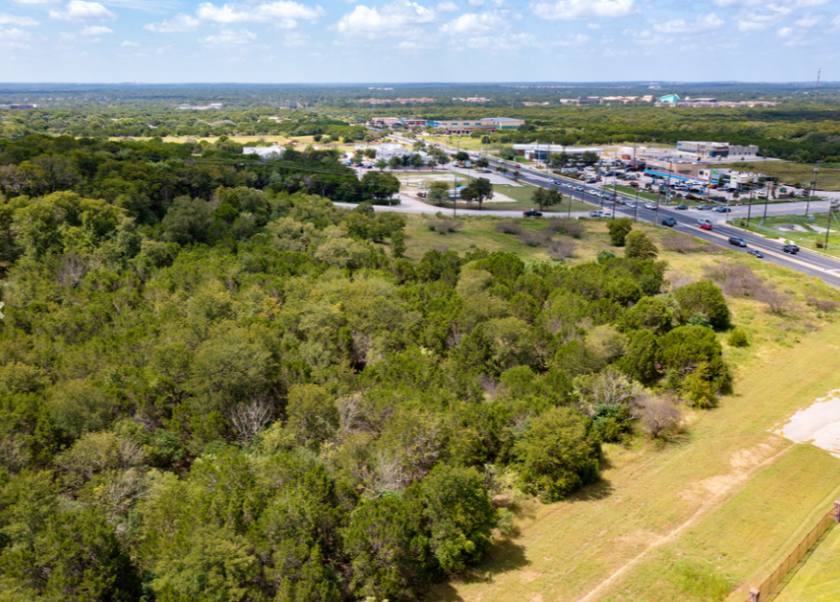
- • Large Acreage Tract Available for Development
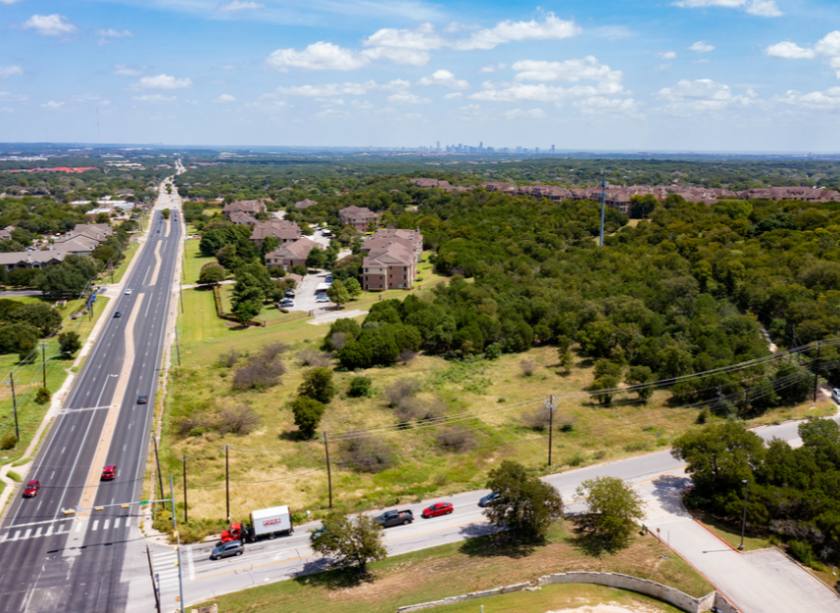
- • 16 miles to ABIA
- • Close to Downtown Austin
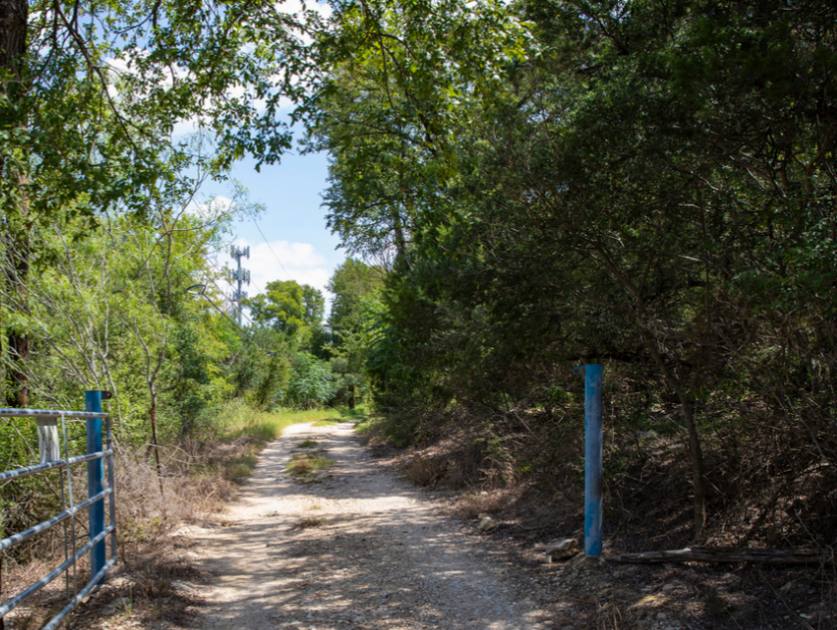
Additional Photos
Listing Agents

Nick Boyd
O: 512-213-4177
M: 512-838-1087
nick.r.boyd@gmail.com
O: 512-213-4177
M: 512-838-1087
nick.r.boyd@gmail.com
While we strive to provide the most accurate information, all listing information, and demographic data, is provided by third-parties. As such, MyEListing will not be responsible for the accuracy of the information. It is strongly recommended that you verify all information with the listing agent, and any relevant agencies, prior to making any decisions.