Office Space
18281 Farm to Market Road 150 West Driftwood, TX 78619
18281 Farm to Market Road 150 West Driftwood, TX 78619

Details & Description
Property Highlights
• Nestled in the scenic Hill Country community of Driftwood
• Centrally located between Austin and San Antonio
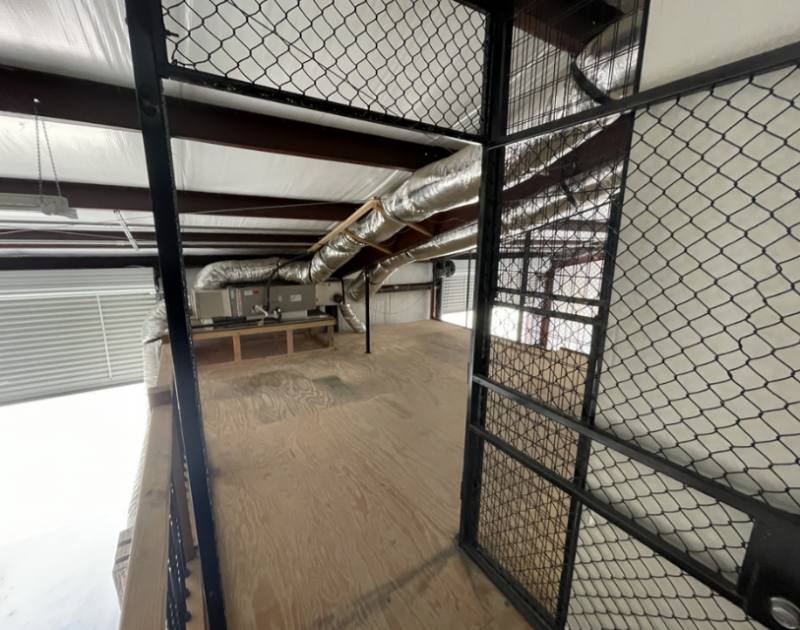
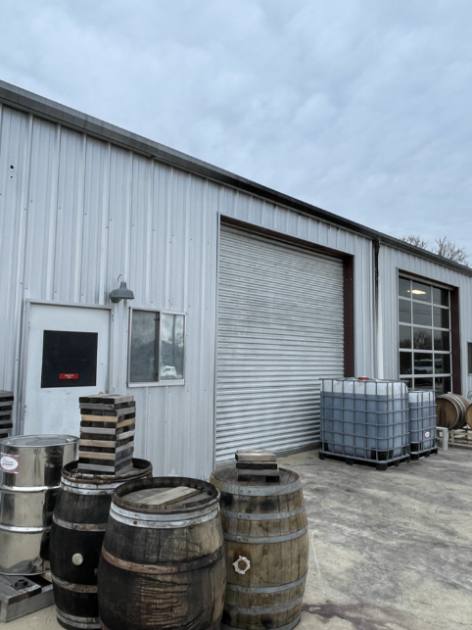
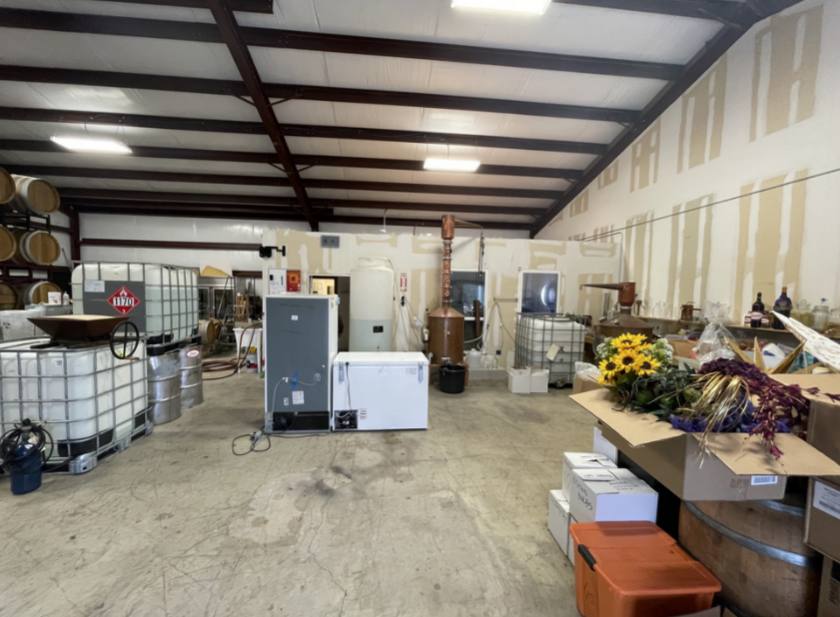
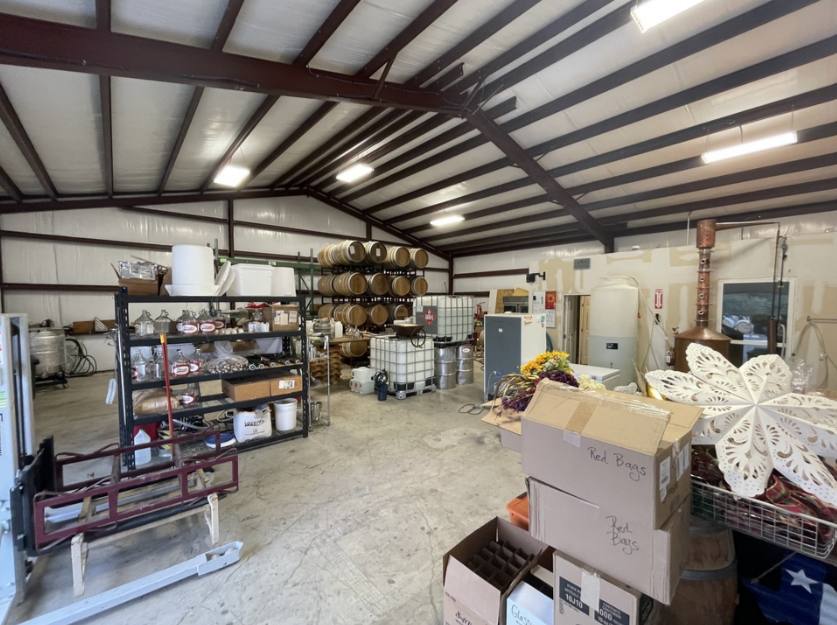
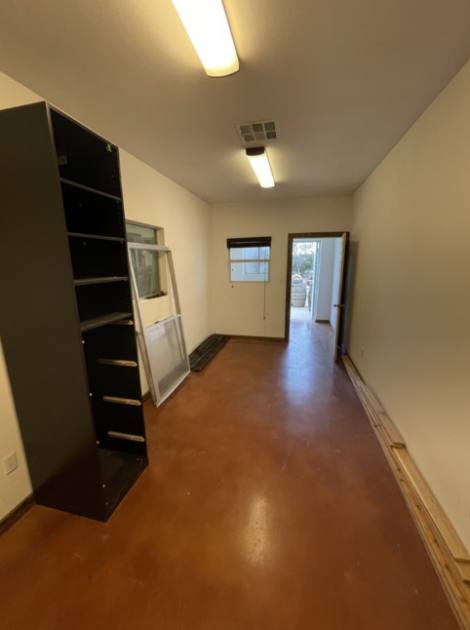
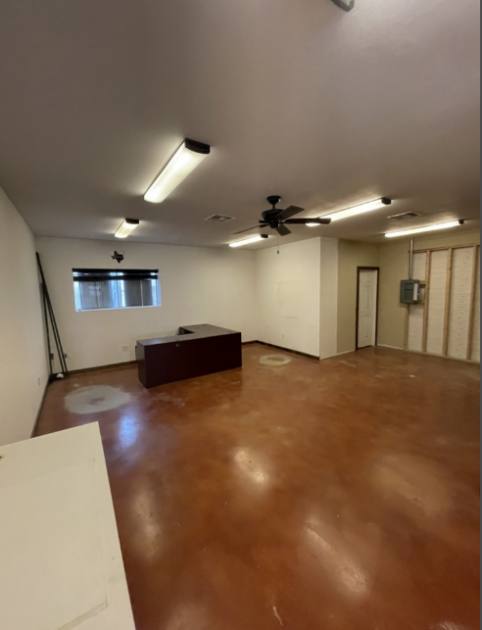
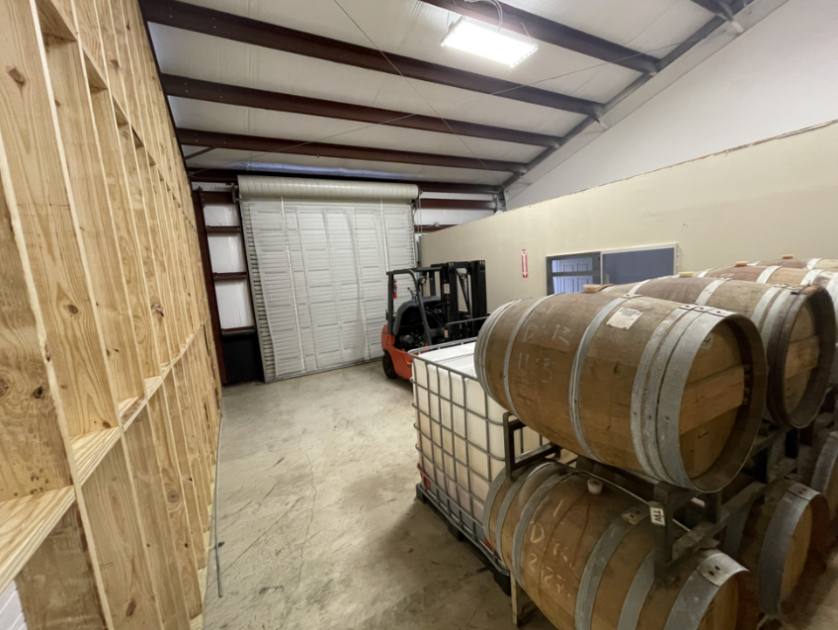
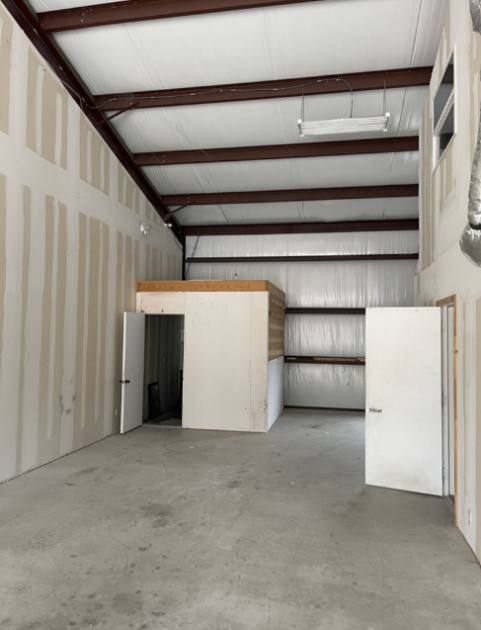
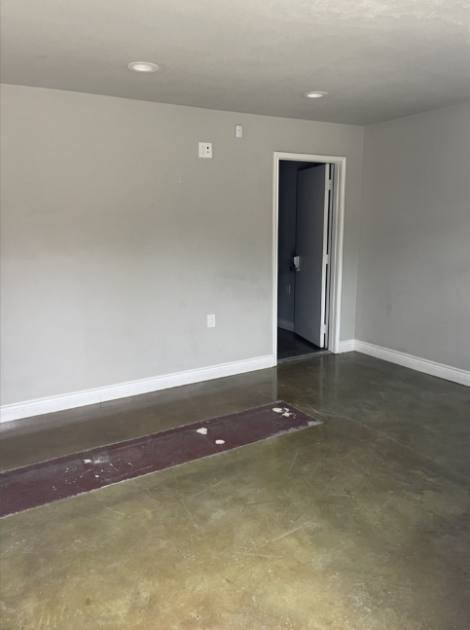
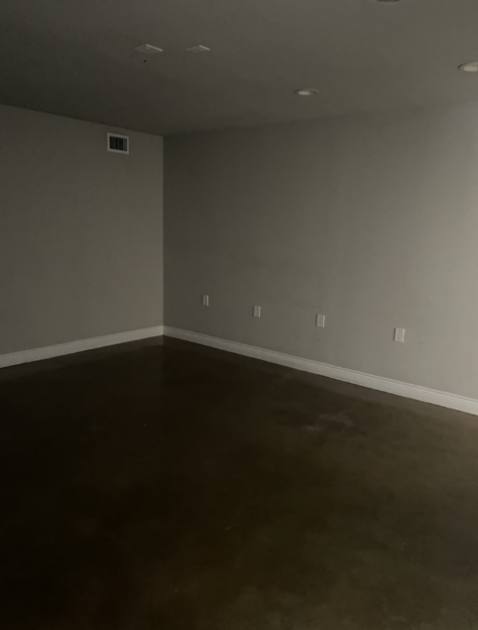
Additional Photos

Listing Agents

Nick Boyd
O: 512-213-4177
M: 512-838-1087
nick.r.boyd@gmail.com
O: 512-213-4177
M: 512-838-1087
nick.r.boyd@gmail.com
While we strive to provide the most accurate information, all listing information, and demographic data, is provided by third-parties. As such, MyEListing will not be responsible for the accuracy of the information. It is strongly recommended that you verify all information with the listing agent, and any relevant agencies, prior to making any decisions.