Office Space
Bentwood Ranch Drive and W Borgfeld Road Cibolo, TX 78108
Bentwood Ranch Drive and W Borgfeld Road Cibolo, TX 78108
Details & Description
Property Highlights
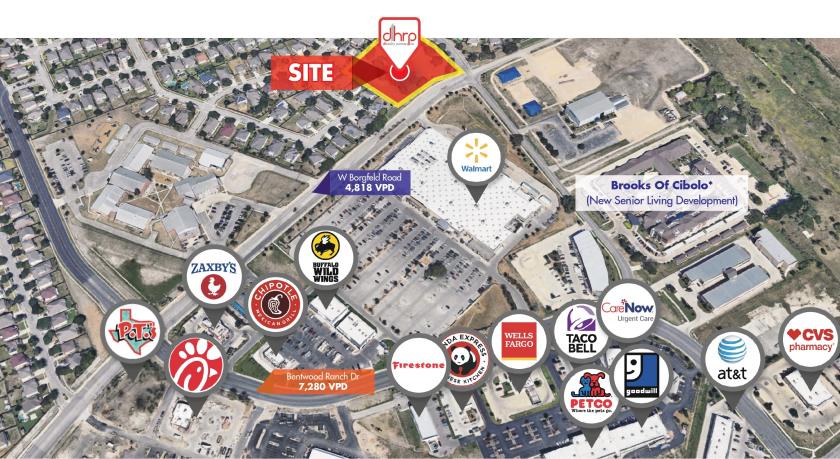
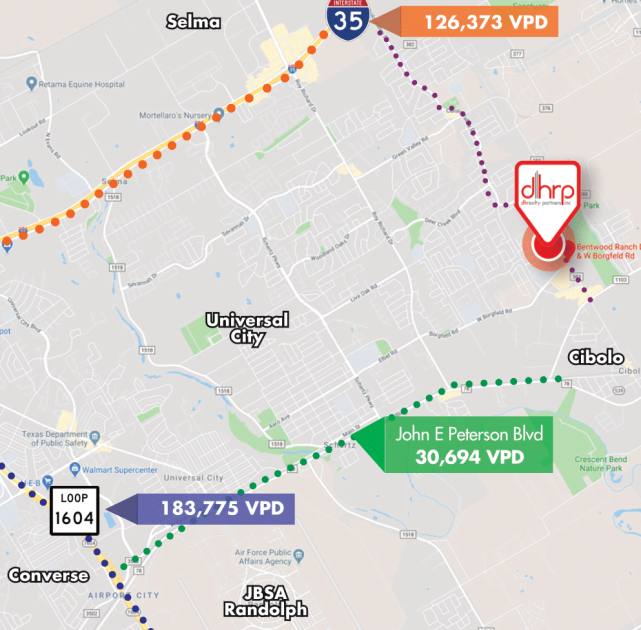
- • PRIME LOCATION
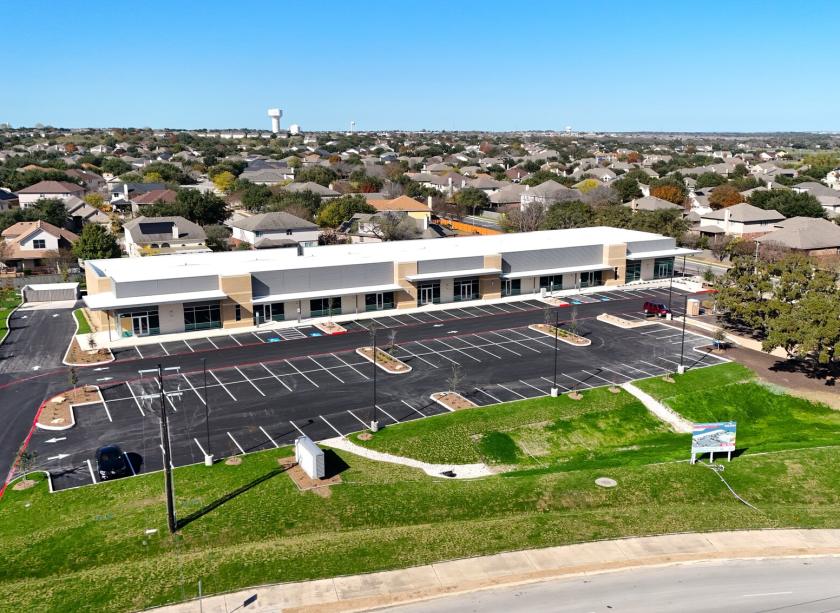
- • Brand new office building
- • Minutes from historic downtown Cibolo, Texas
- • Outstanding visibility
Additional Photos


Listing Agents

Alex Yount
O: 210-222-2424
ayount@dhrp.us
O: 210-222-2424
ayount@dhrp.us

Michael Hoover
O: 210-222-2424
M: 210-218-9095
hoover@dhrp.us
O: 210-222-2424
M: 210-218-9095
hoover@dhrp.us
While we strive to provide the most accurate information, all listing information, and demographic data, is provided by third-parties. As such, MyEListing will not be responsible for the accuracy of the information. It is strongly recommended that you verify all information with the listing agent, and any relevant agencies, prior to making any decisions.