Retail Space
7739 Northcross Drive Austin, TX 78757
7739 Northcross Drive Austin, TX 78757

Details & Description
Property Highlights
- • Pylon Sign Available
- • Exterior Signage - Optional
- • Drive Up Parking
- • Tenant Controlled HVAC 24/7
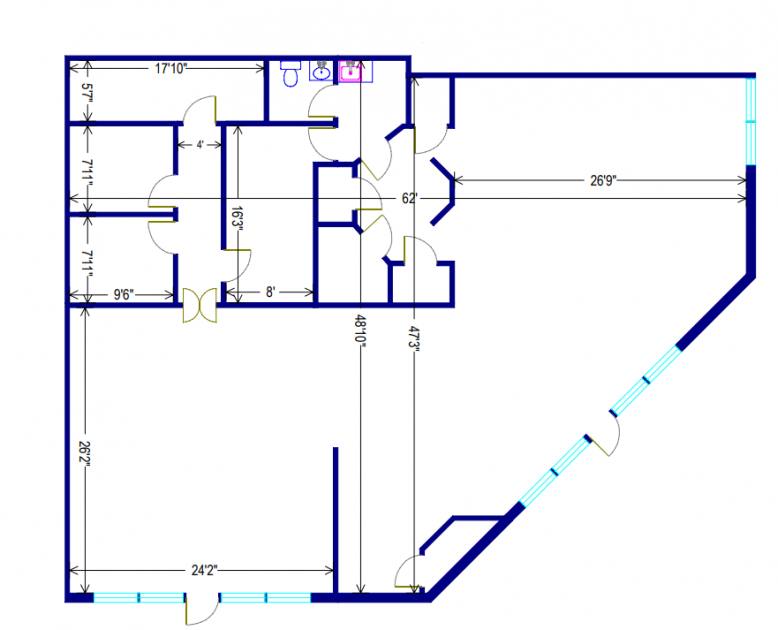
- • 1 Large Open Show Room
- • 4 Dressing Rooms
Listing Agents

Lesley Heaton
O: 512-921-2960
lesleytchco@gmail.com
O: 512-921-2960
lesleytchco@gmail.com
While we strive to provide the most accurate information, all listing information, and demographic data, is provided by third-parties. As such, MyEListing will not be responsible for the accuracy of the information. It is strongly recommended that you verify all information with the listing agent, and any relevant agencies, prior to making any decisions.