Specialty Real Estate
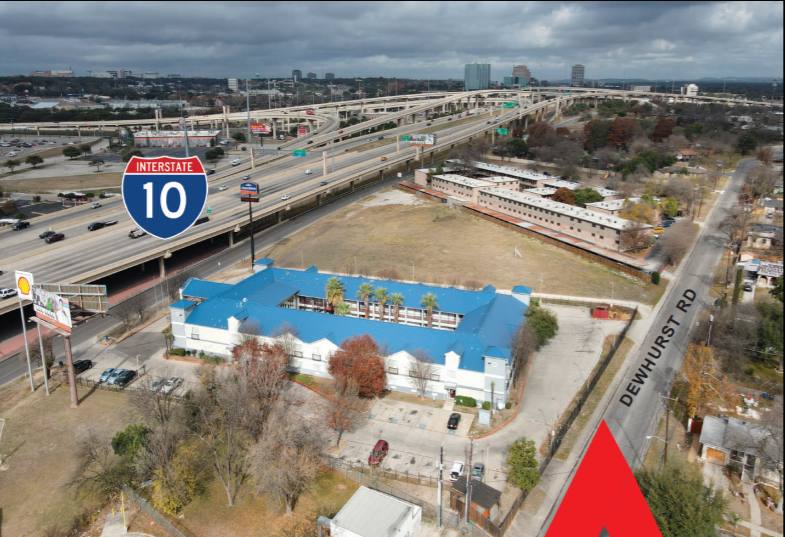
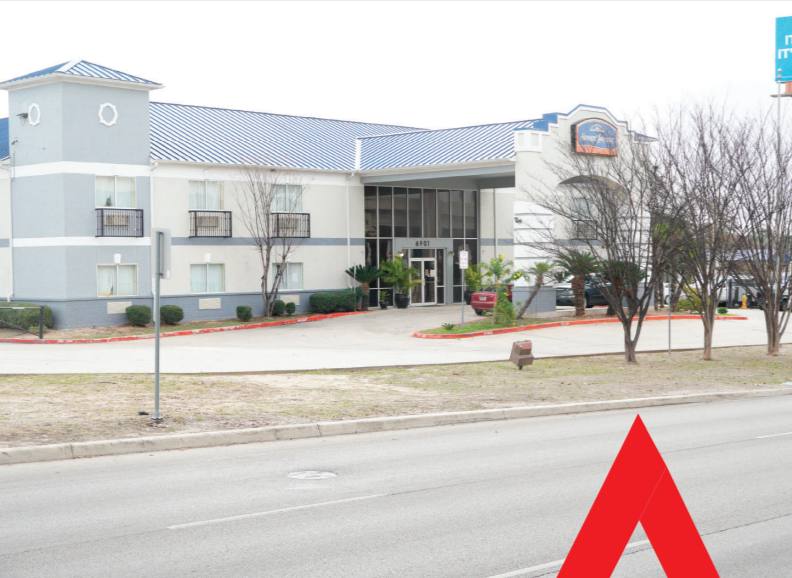
6901 West Interstate 10 San Antonio, TX 78213
6901 West Interstate 10 San Antonio, TX 78213
Details & Description
Listing Agents

Uri Uriah
O: 210-315-8885
M: 512-960-0747
uri@uriahrealestate.com
O: 210-315-8885
M: 512-960-0747
uri@uriahrealestate.com
While we strive to provide the most accurate information, all listing information, and demographic data, is provided by third-parties. As such, MyEListing will not be responsible for the accuracy of the information. It is strongly recommended that you verify all information with the listing agent, and any relevant agencies, prior to making any decisions.