Retail Space
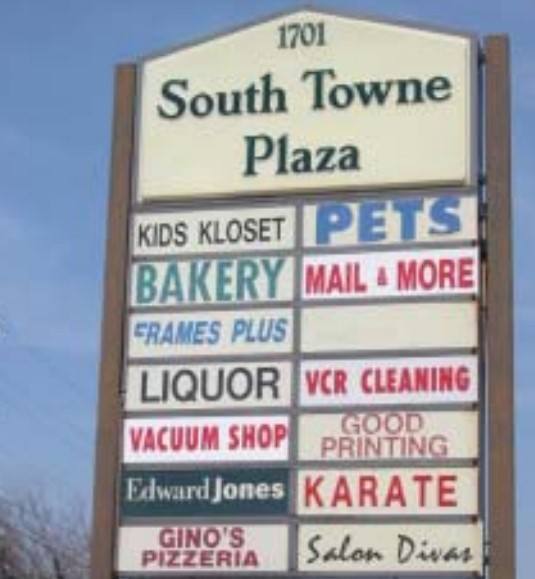
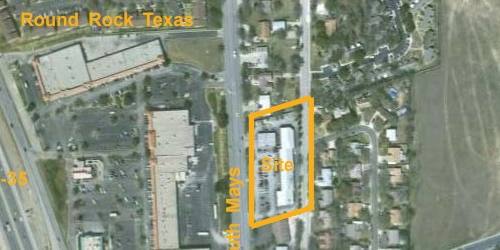
1701 South Mays Street Round Rock, TX 78664
1701 South Mays Street Round Rock, TX 78664
Details & Description
Property Highlights
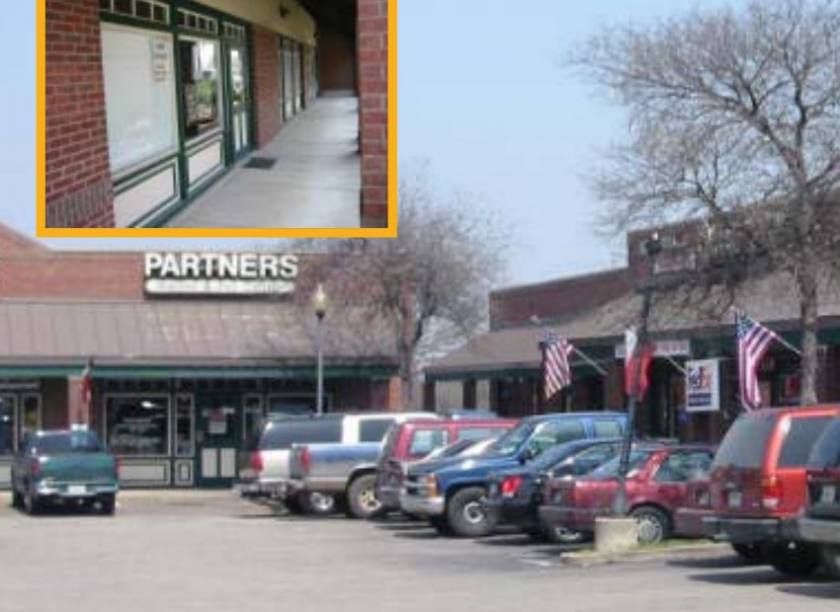
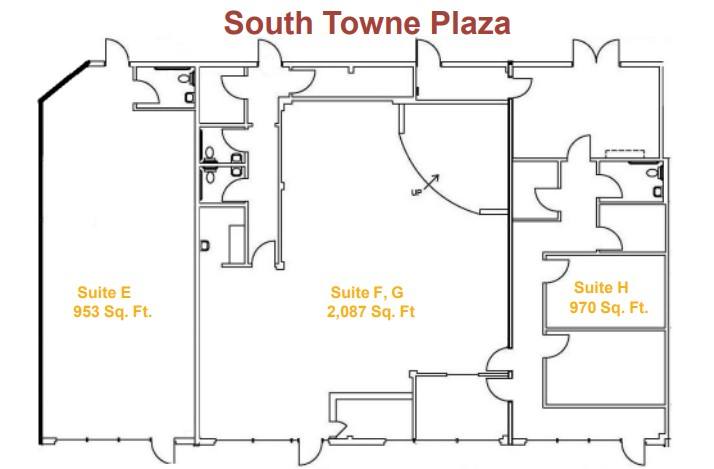
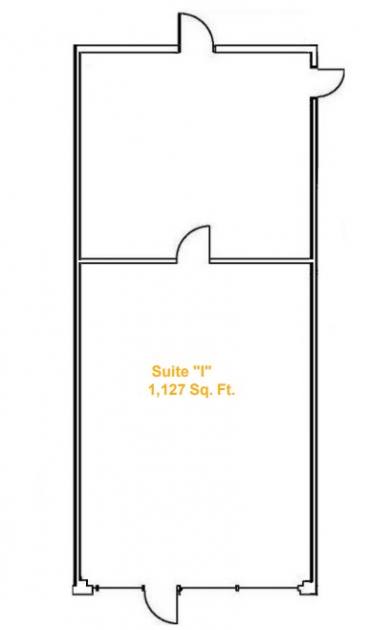
• The suite is located in the courtyard and has limited visibility. It is suitable for destination uses.
• Lease Rate: $16.00 to $18.00 annual base rent per square foot with $4.80 NNN.
Additional Photos
Listing Agents

Robert Hemphill
O: 512-474-2224
robertrhemphill@austin.rr.com
O: 512-474-2224
robertrhemphill@austin.rr.com
While we strive to provide the most accurate information, all listing information, and demographic data, is provided by third-parties. As such, MyEListing will not be responsible for the accuracy of the information. It is strongly recommended that you verify all information with the listing agent, and any relevant agencies, prior to making any decisions.


