Commercial Land
I-35 at Meyers Lane Waco, TX 76705
I-35 at Meyers Lane Waco, TX 76705
Details & Description
Property Highlights
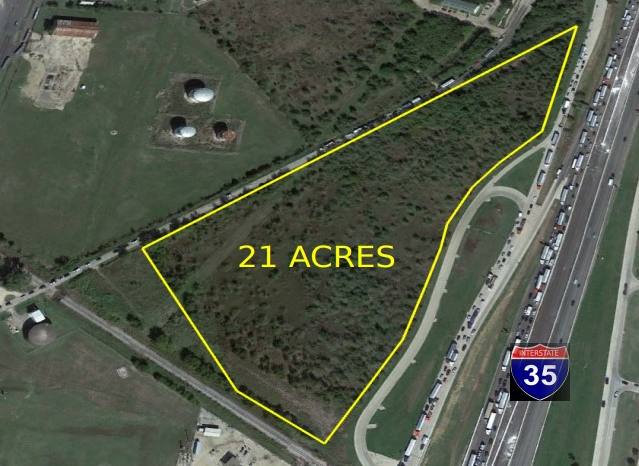
- • 21.07 ACRES (CAN DIVIDE)
- • ZONING C-1 HIGHWAY COMMERCIAL
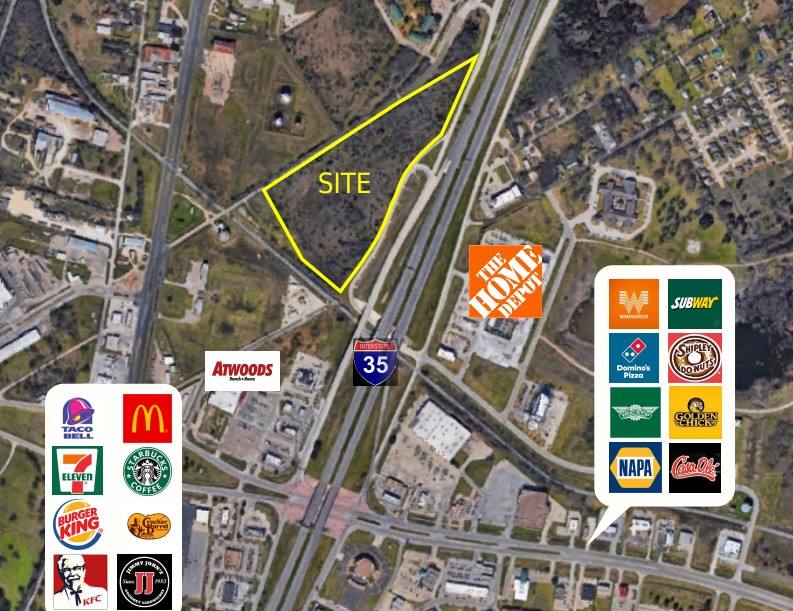
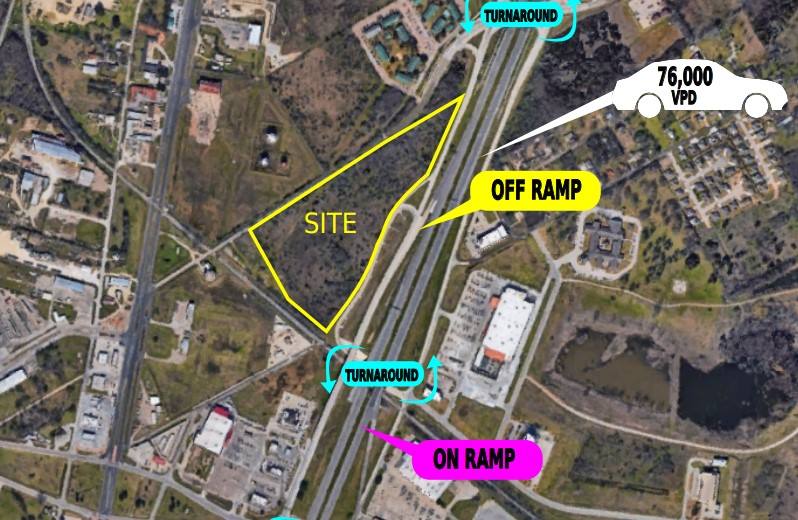
- • HIGH TRAFFIC AND VISIBILITY
- • EASY ACCESS TO I-35
- • UTILITIES AVAILABLE TO SITE
- • CLOSE PROXIMITY TO BAYLOR UNIVERSITY & TSTC
Listing Agents

Raynor Campbell
O: 254-752-9500
M: 254-644-1838
raynor@raynorcampbellcre.com
O: 254-752-9500
M: 254-644-1838
raynor@raynorcampbellcre.com
While we strive to provide the most accurate information, all listing information, and demographic data, is provided by third-parties. As such, MyEListing will not be responsible for the accuracy of the information. It is strongly recommended that you verify all information with the listing agent, and any relevant agencies, prior to making any decisions.