Commercial Land
Alliance Parkway Waco, TX 76712
Alliance Parkway Waco, TX 76712
Details & Description
Property Highlights
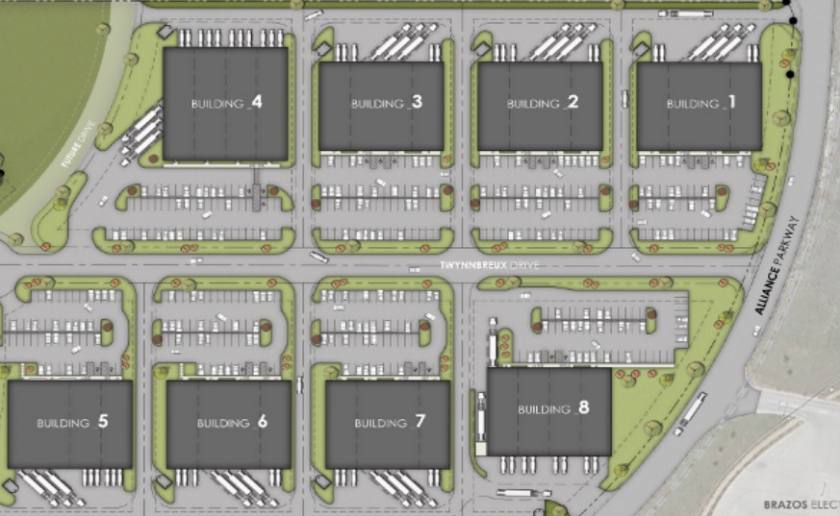
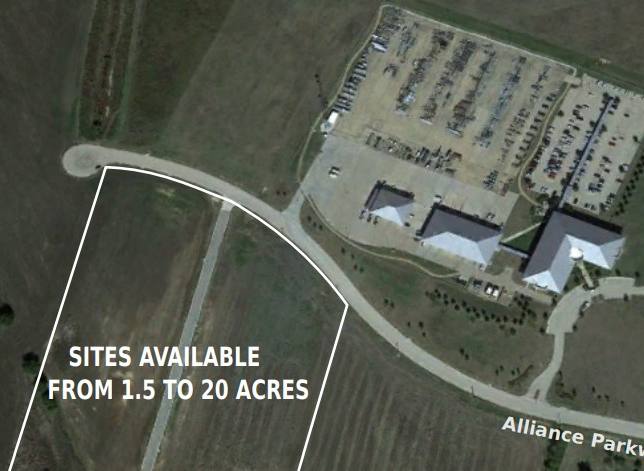
- • SITES AVAILABLE FROM 1.5 TO 20 ACRES
- • DETENTION POND FOR PARK ALREADY IN PLACE
- • FAST AND EASY ACCESS TO I-35 AND HWY 6
- • DOUBLE FREEPORT TAX EXEMPTION AVAILABLE
- • ECONOMIC INCENTIVES AVAILABLE
- • LOT PRICING FROM $3.25 - $3.95/SF
Listing Agents

Raynor Campbell
O: 254-752-9500
M: 254-644-1838
raynor@raynorcampbellcre.com
O: 254-752-9500
M: 254-644-1838
raynor@raynorcampbellcre.com
While we strive to provide the most accurate information, all listing information, and demographic data, is provided by third-parties. As such, MyEListing will not be responsible for the accuracy of the information. It is strongly recommended that you verify all information with the listing agent, and any relevant agencies, prior to making any decisions.