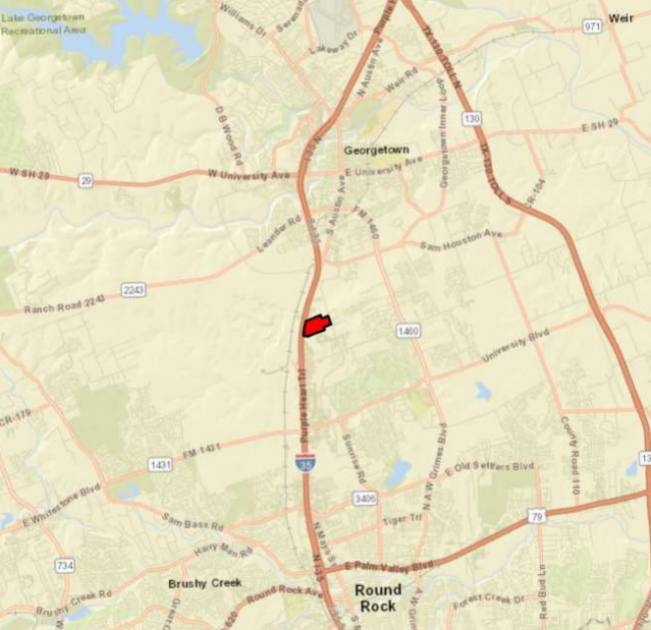
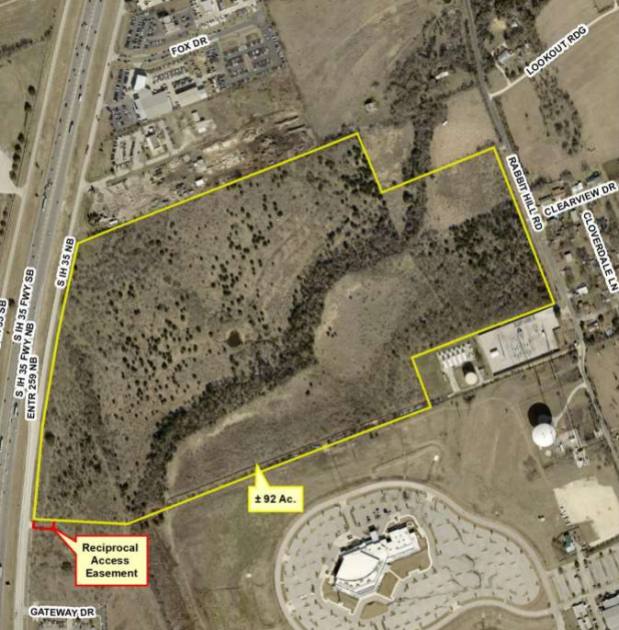
1-Mile | 3-Miles | 5-Miles | ||
---|---|---|---|---|
Total Population | 2,265 | 41,778 | 117,203 | |
Population Median Age | 37 | 36 | 35 | |
Population by Age | 0-9 Yrs | 287 (12%) | 5662 (13%) | 16353 (13%) |
10-19 Yrs | 306 (13%) | 5670 (13%) | 18363 (15%) | |
20-29 Yrs | 271 (11%) | 6090 (14%) | 15417 (13%) | |
30-39 Yrs | 499 (22%) | 7040 (16%) | 17859 (15%) | |
40-49 Yrs | 291 (12%) | 5988 (14%) | 18434 (15%) | |
50-59 Yrs | 189 (8%) | 4836 (11%) | 14106 (12%) | |
60-69 Yrs | 188 (8%) | 3609 (8%) | 9326 (7%) | |
70+ Yrs | 233 (10%) | 2883 (6%) | 7345 (6%) | |
Median HH Income | $91,171 | $86,876 | $93,327 | |
Total Household Income | < 24K | 101 (15%) | 1564 (11%) | 3108 (8%) |
25-49K | 62 (9%) | 2118 (15%) | 5573 (15%) | |
50-74K | 66 (10%) | 2240 (16%) | 5772 (15%) | |
75-99K | 139 (21%) | 2023 (14%) | 5109 (14%) | |
100-199K | 199 (31%) | 4206 (30%) | 12269 (33%) | |
200K+ | 70 (10%) | 1615 (11%) | 4566 (12%) | |
Highest Education Level | No Diploma | 253 | 2048 | 5864 |
Diploma or GED | 315 | 5670 | 14999 | |
Some College | 261 | 5693 | 16130 | |
Assoc. Degree | 164 | 2931 | 6515 | |
Bachelors Degree | 414 | 6695 | 19949 | |
Higher Degree | 160 | 4458 | 10994 | |
Total Housing Units | 648 | 14,655 | 38,471 | |
--Owner-Occupied | 397 | 7,739 | 23,731 | |
--Renter-Occupied | 240 | 6,028 | 12,666 | |
Owner-Occupied Values | < 100K | 0 | 185 | 579 |
100-199K | 53 | 985 | 3741 | |
200-299K | 99 | 3247 | 9293 | |
300-399K | 126 | 2087 | 5450 | |
400-499K | 47 | 731 | 2942 | |
500K+ | 72 | 504 | 1726 | |
Total Working Age Population | 1,779 | 32,325 | 89,498 | |
In Work Force | 946 | 22,833 | 63,711 | |
Not In Work Force | 832 | 9,492 | 25,787 | |
Workforce Employed | 895 | 21,469 | 60,274 | |
Workforce Unemployed | 33 | 1,165 | 3,130 | |
Civlian Workforce | 928 | 22,634 | 63,404 | |
Military Workforce | 18 | 199 | 307 | |
Total Households | 637 | 13,766 | 36,397 | |
Family Households | 461 | 9,773 | 27,299 | |
Non-Family Households | 175 | 3,993 | 9,099 | |
Married Couple | 338 | 7,291 | 21,033 | |
Other Family | 123 | 2,482 | 6,265 | |
Married w/Child | 173 | 3,561 | 10,978 | |
Single Male w/Child | 7 | 284 | 796 | |
Single Female w/Child | 32 | 1,202 | 3,024 |
Population Change Last Two Decades - Plus Projection
2000 | % | 2010 | % | 2020 | % | 2030 | |
---|---|---|---|---|---|---|---|
Texas | 20,851,820 | +21 | 25,145,561 | +18 | 29,677,668 | +18 | 34,894,452 |
Williamson County | 249,967 | +69 | 422,679 | +40 | 589,914 | +41 | 830,421 |
Total Working Age Population:
Total Households:
Total Working Age Population:
Total Households:
Total Working Age Population:
Total Households: