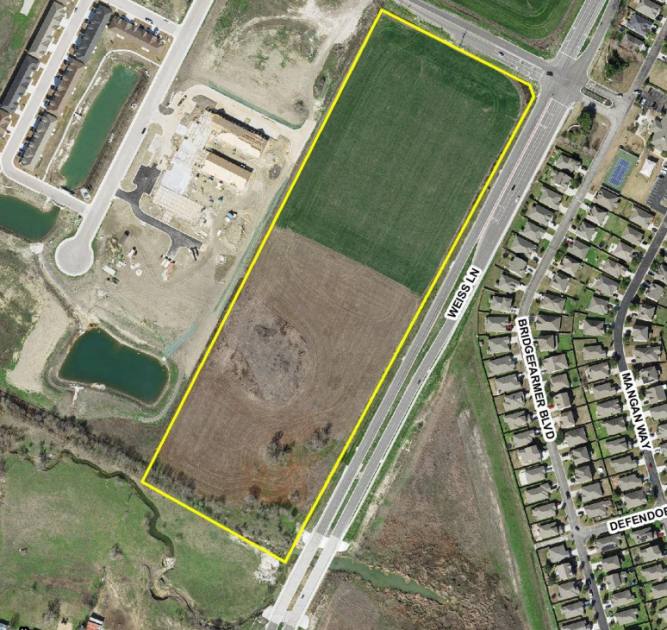
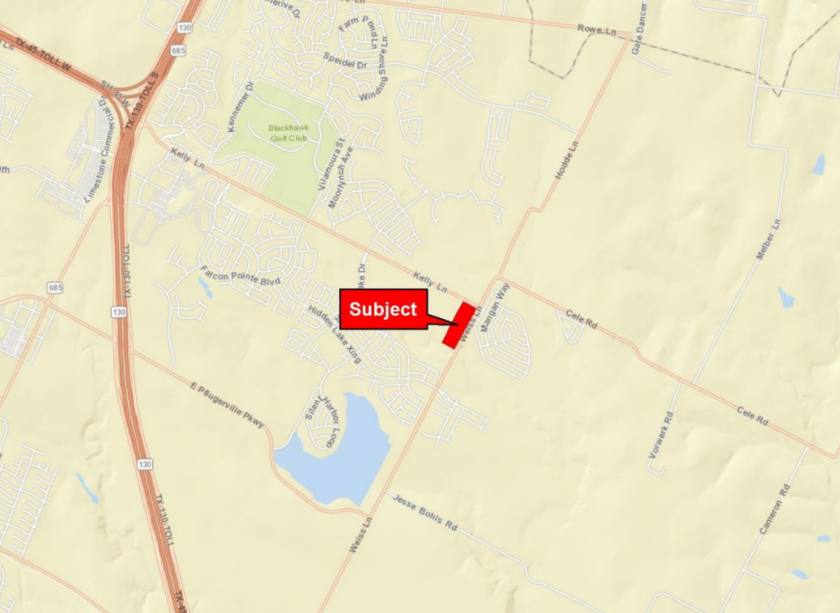
1-Mile | 3-Miles | 5-Miles | ||
---|---|---|---|---|
Total Population | 4,862 | 35,184 | 103,152 | |
Population Median Age | 32 | 33 | 34 | |
Population by Age | 0-9 Yrs | 888 (18%) | 4684 (13%) | 14273 (13%) |
10-19 Yrs | 687 (14%) | 7419 (21%) | 18354 (17%) | |
20-29 Yrs | 386 (7%) | 2754 (7%) | 10969 (10%) | |
30-39 Yrs | 1030 (21%) | 5414 (15%) | 16259 (15%) | |
40-49 Yrs | 1050 (21%) | 7692 (21%) | 18515 (17%) | |
50-59 Yrs | 432 (8%) | 4106 (11%) | 12856 (12%) | |
60-69 Yrs | 249 (5%) | 2158 (6%) | 7435 (7%) | |
70+ Yrs | 141 (2%) | 955 (2%) | 4492 (4%) | |
Median HH Income | $104,298 | $118,507 | $103,637 | |
Total Household Income | < 24K | 103 (5%) | 367 (3%) | 1648 (5%) |
25-49K | 286 (16%) | 749 (6%) | 3661 (11%) | |
50-74K | 180 (10%) | 1211 (10%) | 4718 (14%) | |
75-99K | 253 (14%) | 1581 (14%) | 5528 (16%) | |
100-199K | 694 (39%) | 5957 (53%) | 14020 (42%) | |
200K+ | 228 (13%) | 1242 (11%) | 3080 (9%) | |
Highest Education Level | No Diploma | 106 | 1327 | 4632 |
Diploma or GED | 475 | 5005 | 15023 | |
Some College | 741 | 4571 | 15571 | |
Assoc. Degree | 367 | 2214 | 5622 | |
Bachelors Degree | 1078 | 6617 | 18086 | |
Higher Degree | 421 | 2512 | 7493 | |
Total Housing Units | 1,781 | 11,350 | 33,706 | |
--Owner-Occupied | 1,708 | 10,218 | 26,439 | |
--Renter-Occupied | 37 | 890 | 6,216 | |
Owner-Occupied Values | < 100K | 25 | 143 | 986 |
100-199K | 60 | 381 | 3405 | |
200-299K | 882 | 4631 | 12413 | |
300-399K | 478 | 4082 | 7586 | |
400-499K | 197 | 700 | 1169 | |
500K+ | 65 | 281 | 880 | |
Total Working Age Population | 3,443 | 25,062 | 76,814 | |
In Work Force | 2,794 | 19,654 | 58,578 | |
Not In Work Force | 650 | 5,408 | 18,236 | |
Workforce Employed | 2,707 | 19,105 | 55,681 | |
Workforce Unemployed | 87 | 419 | 2,719 | |
Civlian Workforce | 2,794 | 19,524 | 58,400 | |
Military Workforce | 0 | 130 | 178 | |
Total Households | 1,745 | 11,108 | 32,655 | |
Family Households | 1,358 | 9,422 | 25,986 | |
Non-Family Households | 387 | 1,686 | 6,670 | |
Married Couple | 1,101 | 8,132 | 21,172 | |
Other Family | 257 | 1,290 | 4,814 | |
Married w/Child | 702 | 5,217 | 12,235 | |
Single Male w/Child | 40 | 290 | 822 | |
Single Female w/Child | 101 | 446 | 1,974 |
Population Change Last Two Decades - Plus Projection
2000 | % | 2010 | % | 2020 | % | 2030 | |
---|---|---|---|---|---|---|---|
Texas | 20,851,820 | +21 | 25,145,561 | +18 | 29,677,668 | +18 | 34,894,452 |
Travis County | 812,280 | +26 | 1,024,266 | +26 | 1,291,502 | +19 | 1,540,812 |
Williamson County | 249,967 | +69 | 422,679 | +40 | 589,914 | +41 | 830,421 |
Total Working Age Population:
Total Households:
Total Working Age Population:
Total Households:
Total Working Age Population:
Total Households: