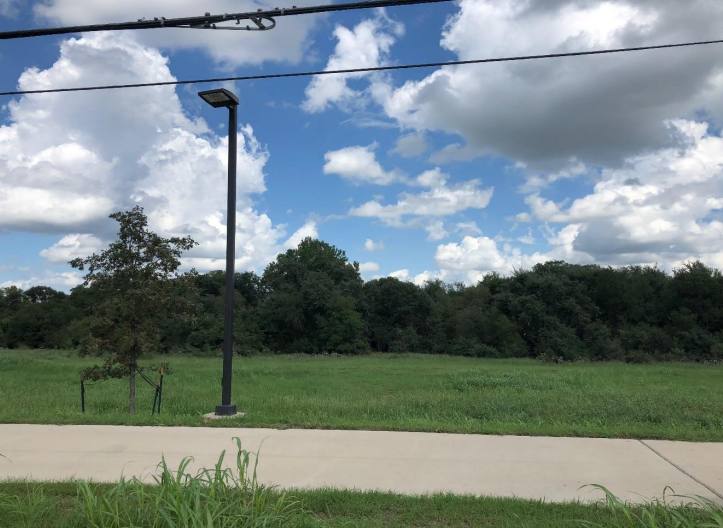
1-Mile | 3-Miles | 5-Miles | ||
---|---|---|---|---|
Total Population | 934 | 34,759 | 141,160 | |
Population Median Age | 34 | 33 | 34 | |
Population by Age | 0-9 Yrs | 133 (14%) | 3748 (10%) | 15759 (11%) |
10-19 Yrs | 162 (17%) | 4513 (12%) | 15562 (11%) | |
20-29 Yrs | 137 (14%) | 8454 (24%) | 32642 (23%) | |
30-39 Yrs | 123 (13%) | 6830 (19%) | 30370 (21%) | |
40-49 Yrs | 128 (13%) | 4217 (12%) | 18252 (12%) | |
50-59 Yrs | 120 (12%) | 3372 (9%) | 13227 (9%) | |
60-69 Yrs | 74 (7%) | 2110 (6%) | 9355 (6%) | |
70+ Yrs | 55 (5%) | 1515 (4%) | 5993 (4%) | |
Median HH Income | $47,503 | $59,469 | $60,952 | |
Total Household Income | < 24K | 76 (24%) | 2654 (23%) | 10808 (20%) |
25-49K | 90 (29%) | 2015 (17%) | 11135 (21%) | |
50-74K | 55 (17%) | 1987 (17%) | 9111 (17%) | |
75-99K | 47 (15%) | 1660 (14%) | 6207 (11%) | |
100-199K | 35 (11%) | 2637 (23%) | 12356 (23%) | |
200K+ | 6 (1%) | 355 (3%) | 3081 (5%) | |
Highest Education Level | No Diploma | 204 | 4713 | 18440 |
Diploma or GED | 186 | 6400 | 21330 | |
Some College | 93 | 4371 | 17370 | |
Assoc. Degree | 24 | 685 | 4180 | |
Bachelors Degree | 56 | 4540 | 24229 | |
Higher Degree | 20 | 1654 | 11233 | |
Total Housing Units | 338 | 11,958 | 57,193 | |
--Owner-Occupied | 163 | 5,454 | 21,329 | |
--Renter-Occupied | 147 | 5,852 | 31,369 | |
Owner-Occupied Values | < 100K | 70 | 950 | 2531 |
100-199K | 35 | 1160 | 4654 | |
200-299K | 27 | 2144 | 5435 | |
300-399K | 23 | 738 | 3336 | |
400-499K | 6 | 315 | 2132 | |
500K+ | 2 | 148 | 3241 | |
Total Working Age Population | 713 | 28,348 | 116,399 | |
In Work Force | 478 | 19,702 | 86,740 | |
Not In Work Force | 235 | 8,646 | 29,658 | |
Workforce Employed | 456 | 18,548 | 82,966 | |
Workforce Unemployed | 22 | 1,146 | 3,668 | |
Civlian Workforce | 478 | 19,694 | 86,634 | |
Military Workforce | 0 | 8 | 106 | |
Total Households | 310 | 11,307 | 52,698 | |
Family Households | 190 | 6,014 | 25,399 | |
Non-Family Households | 120 | 5,293 | 27,300 | |
Married Couple | 109 | 3,541 | 14,911 | |
Other Family | 82 | 2,473 | 10,488 | |
Married w/Child | 64 | 1,784 | 6,276 | |
Single Male w/Child | 9 | 70 | 840 | |
Single Female w/Child | 34 | 903 | 4,127 |
Population Change Last Two Decades - Plus Projection
2000 | % | 2010 | % | 2020 | % | 2030 | |
---|---|---|---|---|---|---|---|
Texas | 20,851,820 | +21 | 25,145,561 | +18 | 29,677,668 | +18 | 34,894,452 |
Travis County | 812,280 | +26 | 1,024,266 | +26 | 1,291,502 | +19 | 1,540,812 |
Total Working Age Population:
Total Households:
Total Working Age Population:
Total Households:
Total Working Age Population:
Total Households: