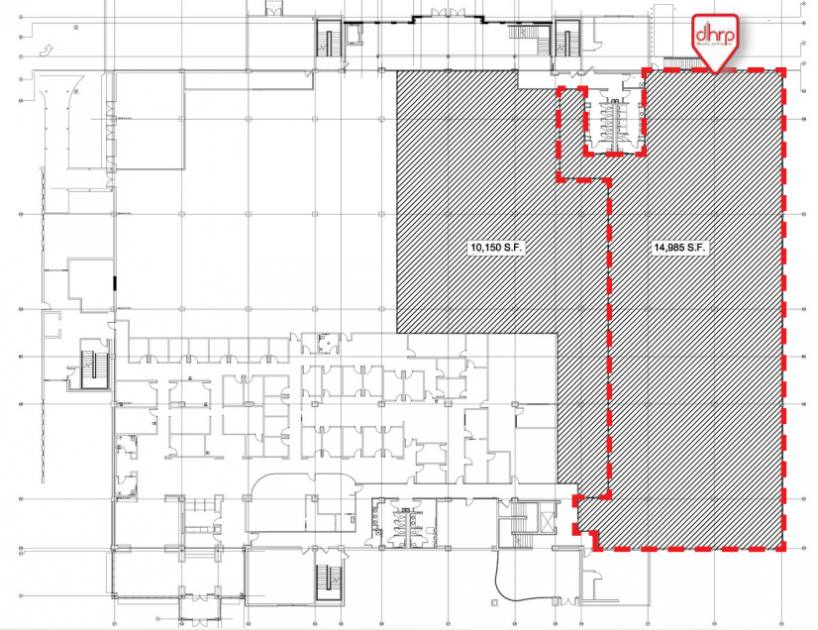
Office Space
9725 Datapoint Drive San Antonio, TX 78229
9725 Datapoint Drive San Antonio, TX 78229

Details & Description
Property Highlights
- • New common areas and exterior improvements.
- • High efficiency / Low energy HVAC System
- • Generous TI allowances
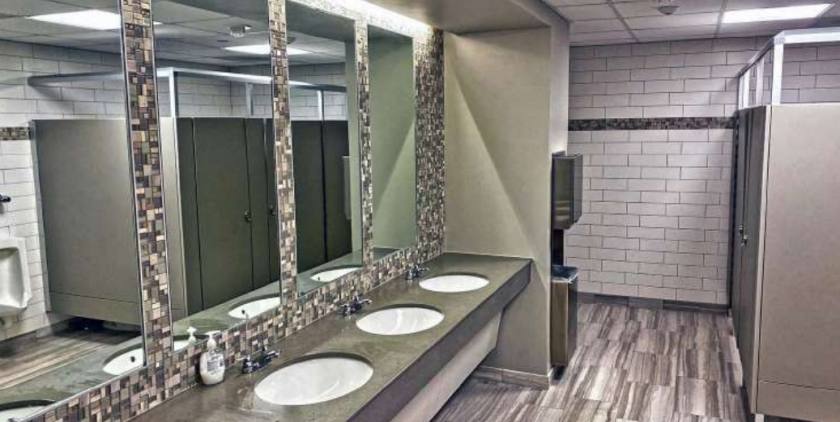
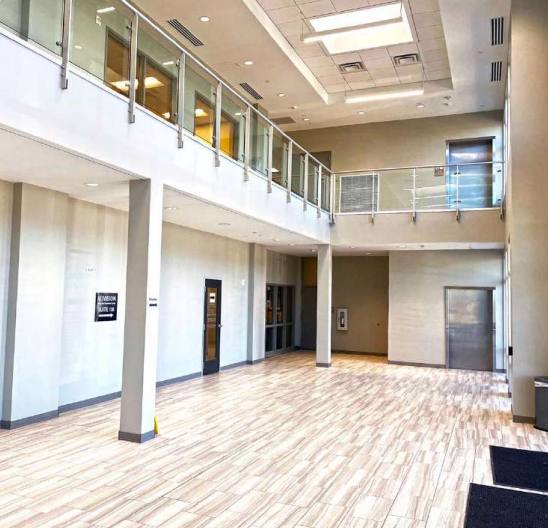
Additional Photos


Listing Agents

Michael Hoover
O: 210-222-2424
M: 210-218-9095
hoover@dhrp.us
O: 210-222-2424
M: 210-218-9095
hoover@dhrp.us
While we strive to provide the most accurate information, all listing information, and demographic data, is provided by third-parties. As such, MyEListing will not be responsible for the accuracy of the information. It is strongly recommended that you verify all information with the listing agent, and any relevant agencies, prior to making any decisions.