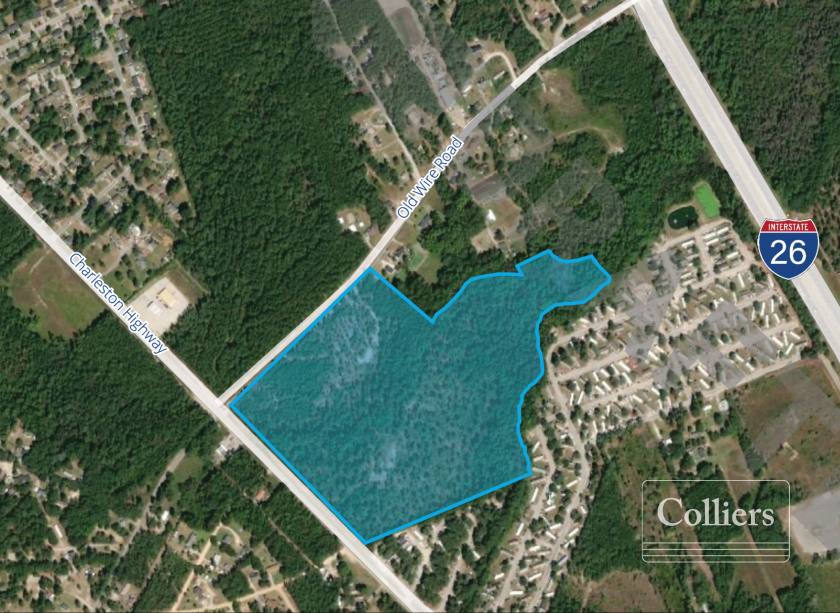
1-Mile | 3-Miles | 5-Miles | ||
---|---|---|---|---|
Total Population | 1,054 | 9,308 | 24,454 | |
Population Median Age | 36 | 38 | 39 | |
Population by Age | 0-9 Yrs | 169 (16%) | 1205 (12%) | 2565 (10%) |
10-19 Yrs | 143 (13%) | 1466 (15%) | 3404 (13%) | |
20-29 Yrs | 102 (9%) | 1095 (11%) | 4097 (16%) | |
30-39 Yrs | 188 (17%) | 1172 (12%) | 2997 (12%) | |
40-49 Yrs | 109 (10%) | 967 (10%) | 2504 (10%) | |
50-59 Yrs | 125 (11%) | 1061 (11%) | 2886 (11%) | |
60-69 Yrs | 177 (16%) | 1697 (18%) | 3764 (15%) | |
70+ Yrs | 42 (3%) | 645 (6%) | 2238 (9%) | |
Median HH Income | $39,720 | $47,338 | $46,951 | |
Total Household Income | < 24K | 135 (34%) | 902 (26%) | 2476 (25%) |
25-49K | 87 (22%) | 931 (27%) | 2668 (27%) | |
50-74K | 80 (20%) | 612 (18%) | 1677 (17%) | |
75-99K | 59 (15%) | 512 (15%) | 1362 (14%) | |
100-199K | 24 (6%) | 388 (11%) | 1247 (13%) | |
200K+ | 4 (1%) | 50 (1%) | 145 (1%) | |
Highest Education Level | No Diploma | 174 | 1070 | 2563 |
Diploma or GED | 244 | 2280 | 5729 | |
Some College | 140 | 1309 | 3532 | |
Assoc. Degree | 45 | 411 | 1226 | |
Bachelors Degree | 64 | 678 | 1929 | |
Higher Degree | 32 | 301 | 994 | |
Total Housing Units | 422 | 3,817 | 10,795 | |
--Owner-Occupied | 264 | 2,412 | 6,308 | |
--Renter-Occupied | 125 | 983 | 3,267 | |
Owner-Occupied Values | < 100K | 136 | 815 | 2248 |
100-199K | 120 | 1379 | 3222 | |
200-299K | 6 | 165 | 641 | |
300-399K | 0 | 23 | 129 | |
400-499K | 0 | 3 | 12 | |
500K+ | 3 | 27 | 55 | |
Total Working Age Population | 797 | 7,023 | 19,347 | |
In Work Force | 468 | 4,079 | 11,721 | |
Not In Work Force | 329 | 2,944 | 7,626 | |
Workforce Employed | 416 | 3,692 | 10,856 | |
Workforce Unemployed | 51 | 365 | 829 | |
Civlian Workforce | 468 | 4,058 | 11,685 | |
Military Workforce | 0 | 21 | 36 | |
Total Households | 389 | 3,396 | 9,574 | |
Family Households | 236 | 2,226 | 5,888 | |
Non-Family Households | 153 | 1,169 | 3,686 | |
Married Couple | 126 | 1,401 | 3,764 | |
Other Family | 110 | 825 | 2,125 | |
Married w/Child | 67 | 568 | 1,338 | |
Single Male w/Child | 15 | 79 | 216 | |
Single Female w/Child | 26 | 211 | 626 |
Population Change Last Two Decades - Plus Projection
2000 | % | 2010 | % | 2020 | % | 2030 | |
---|---|---|---|---|---|---|---|
South Carolina | 4,012,012 | +15 | 4,625,364 | +9 | 5,020,400 | +9 | 5,488,460 |
Calhoun County | 15,185 | 0 | 15,175 | +10 | 16,660 | +8 | 17,980 |
Lexington County | 216,014 | +21 | 262,391 | +12 | 294,510 | +13 | 333,180 |
Richland County | 320,677 | +20 | 384,504 | +3 | 395,920 | +8 | 425,960 |
Total Working Age Population:
Total Households:
Total Working Age Population:
Total Households:
Total Working Age Population:
Total Households: