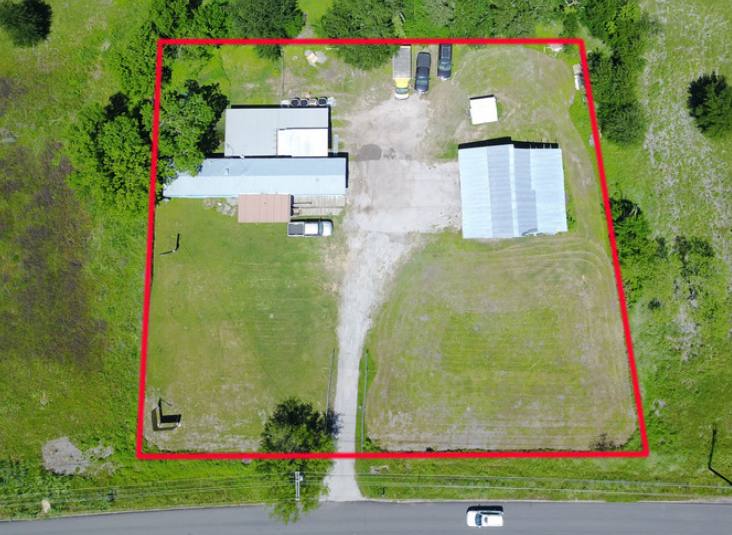
Commercial Land
12210 Old Highway 20 Manor, TX 78653
12210 Old Highway 20 Manor, TX 78653
Details & Description
Property Highlights
- • Located in the Opportunity Zone
- • Wal-Mart Anchored Retail Hub less than a mile away
- • Utilities and Wastewater located near Old Hwy 20
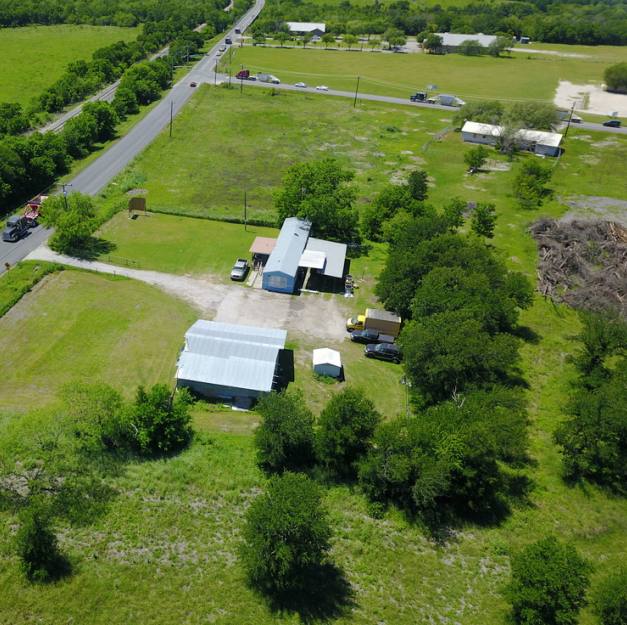
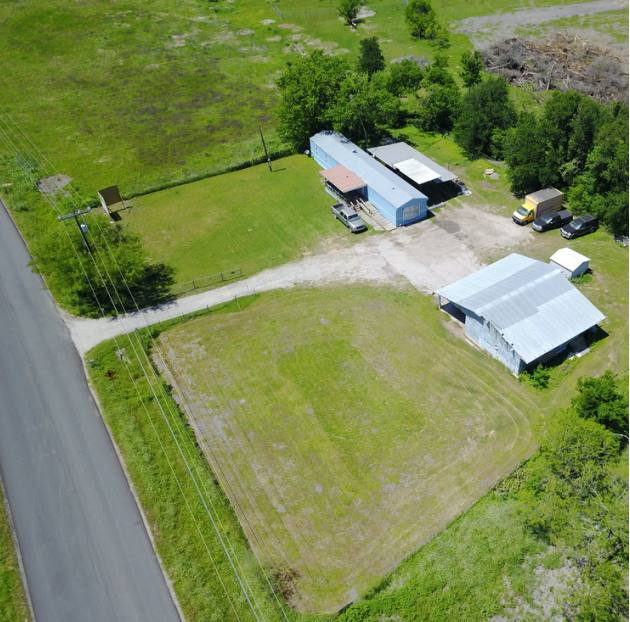
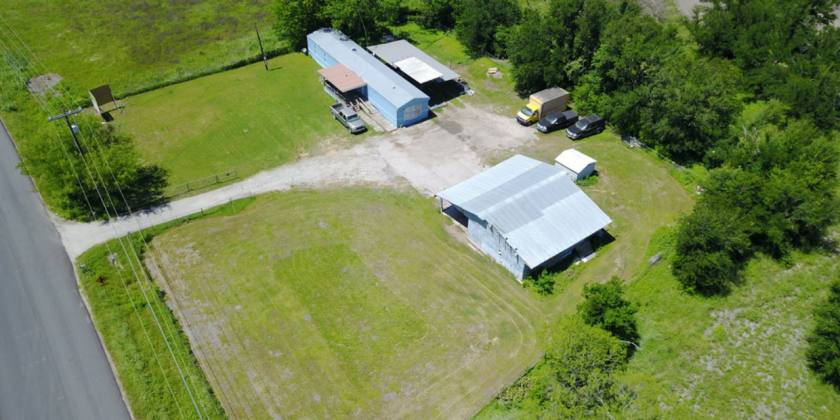
Additional Photos
Listing Agents

Martha Denham
O: 512-912-1070
M: 512-831-8586
martha@cmeatx.com
O: 512-912-1070
M: 512-831-8586
martha@cmeatx.com

Dean Rowat
O: 512-912-1070
M: 512-593-1117
dean@cmeatx.com
O: 512-912-1070
M: 512-593-1117
dean@cmeatx.com
While we strive to provide the most accurate information, all listing information, and demographic data, is provided by third-parties. As such, MyEListing will not be responsible for the accuracy of the information. It is strongly recommended that you verify all information with the listing agent, and any relevant agencies, prior to making any decisions.


