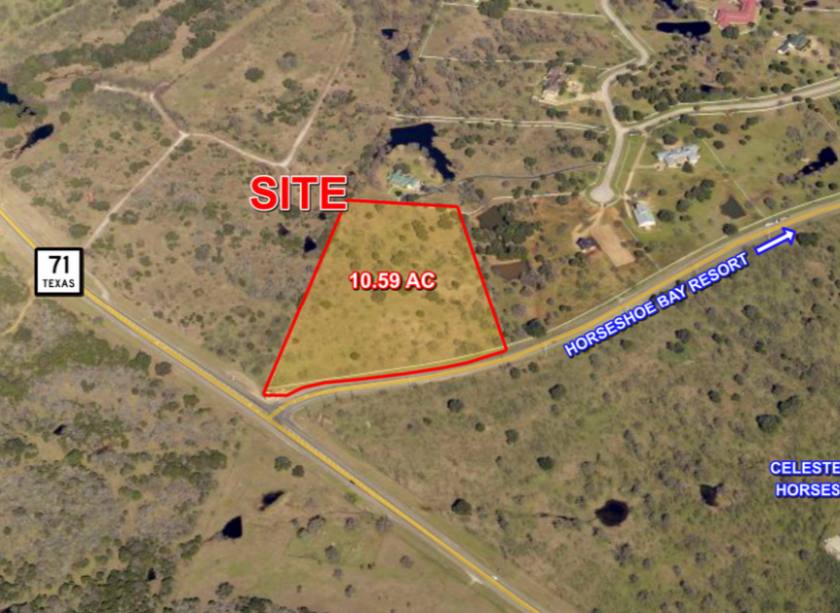
1-Mile | 3-Miles | 5-Miles | ||
---|---|---|---|---|
Total Population | 245 | 2,387 | 7,785 | |
Population Median Age | 63 | 63 | 53 | |
Population by Age | 0-9 Yrs | 6 (2%) | 63 (2%) | 426 (5%) |
10-19 Yrs | 20 (8%) | 181 (7%) | 990 (12%) | |
20-29 Yrs | 2 (0%) | 31 (1%) | 334 (4%) | |
30-39 Yrs | 8 (3%) | 90 (3%) | 539 (6%) | |
40-49 Yrs | 7 (2%) | 75 (3%) | 662 (8%) | |
50-59 Yrs | 18 (7%) | 179 (7%) | 852 (10%) | |
60-69 Yrs | 66 (26%) | 640 (26%) | 1593 (20%) | |
70+ Yrs | 118 (48%) | 1127 (47%) | 2390 (30%) | |
Median HH Income | $102,813 | $98,147 | $72,966 | |
Total Household Income | < 24K | 12 (10%) | 143 (11%) | 473 (14%) |
25-49K | 16 (13%) | 196 (16%) | 684 (20%) | |
50-74K | 15 (12%) | 134 (11%) | 567 (16%) | |
75-99K | 14 (11%) | 135 (11%) | 377 (11%) | |
100-199K | 43 (35%) | 389 (32%) | 876 (26%) | |
200K+ | 20 (16%) | 198 (16%) | 390 (11%) | |
Highest Education Level | No Diploma | 2 | 22 | 620 |
Diploma or GED | 37 | 394 | 1389 | |
Some College | 48 | 487 | 1437 | |
Assoc. Degree | 8 | 89 | 274 | |
Bachelors Degree | 91 | 852 | 1828 | |
Higher Degree | 31 | 290 | 648 | |
Total Housing Units | 221 | 2,379 | 6,543 | |
--Owner-Occupied | 112 | 1,069 | 2,931 | |
--Renter-Occupied | 7 | 125 | 435 | |
Owner-Occupied Values | < 100K | 1 | 11 | 301 |
100-199K | 16 | 154 | 677 | |
200-299K | 15 | 145 | 343 | |
300-399K | 37 | 334 | 587 | |
400-499K | 10 | 93 | 226 | |
500K+ | 34 | 331 | 798 | |
Total Working Age Population | 226 | 2,209 | 6,820 | |
In Work Force | 67 | 682 | 2,952 | |
Not In Work Force | 159 | 1,527 | 3,867 | |
Workforce Employed | 61 | 617 | 2,804 | |
Workforce Unemployed | 6 | 65 | 149 | |
Civlian Workforce | 67 | 682 | 2,952 | |
Military Workforce | 0 | 0 | 0 | |
Total Households | 120 | 1,194 | 3,367 | |
Family Households | 88 | 836 | 2,363 | |
Non-Family Households | 32 | 359 | 1,003 | |
Married Couple | 82 | 783 | 2,105 | |
Other Family | 6 | 52 | 259 | |
Married w/Child | 3 | 30 | 366 | |
Single Male w/Child | 0 | 0 | 12 | |
Single Female w/Child | 2 | 13 | 92 |
Population Change Last Two Decades - Plus Projection
2000 | % | 2010 | % | 2020 | % | 2030 | |
---|---|---|---|---|---|---|---|
Texas | 20,851,820 | +21 | 25,145,561 | +18 | 29,677,668 | +18 | 34,894,452 |
Burnet County | 34,147 | +25 | 42,750 | +13 | 48,196 | +11 | 53,458 |
Blanco County | 8,418 | +25 | 10,497 | +10 | 11,504 | +8 | 12,407 |
Llano County | 17,044 | +13 | 19,301 | +1 | 19,452 | 0 | 19,517 |
Total Working Age Population:
Total Households:
Total Working Age Population:
Total Households:
Total Working Age Population:
Total Households: