Commercial Land
Duff Drive and Blakey Lane Bastrop, TX 78602
Duff Drive and Blakey Lane Bastrop, TX 78602
Details & Description
Property Highlights
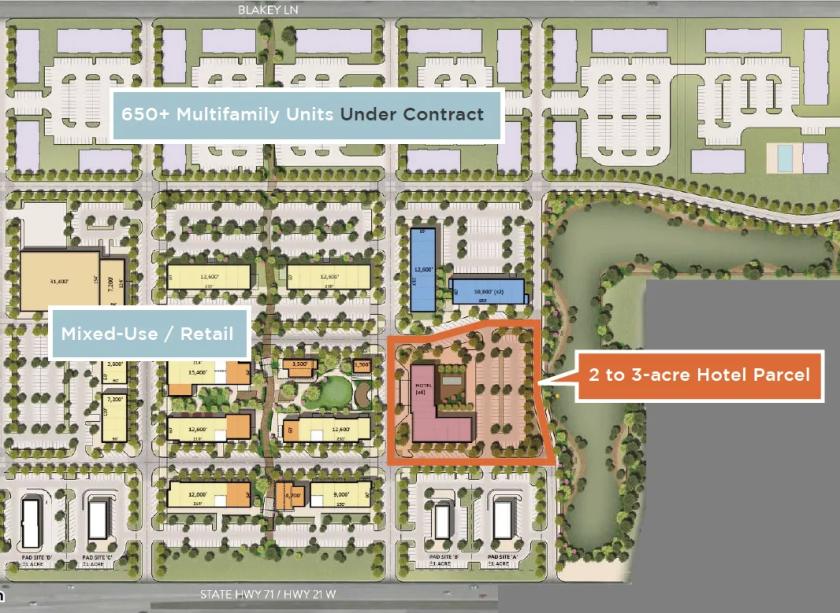
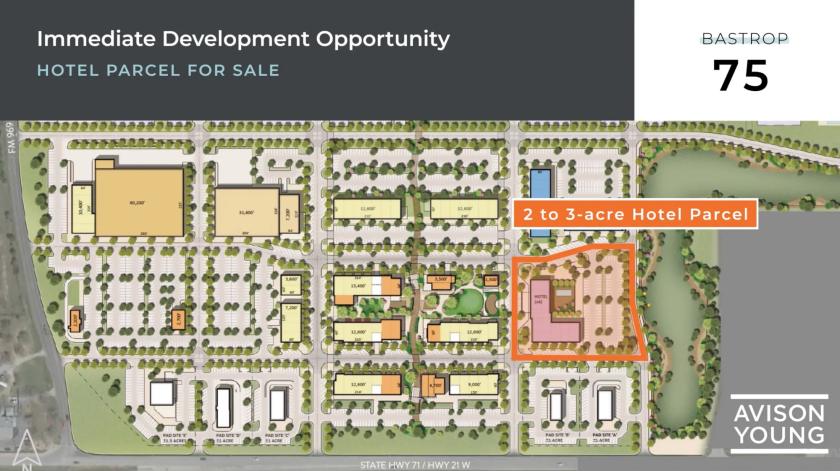
- • 2 to 3-acre lifestyle hotel development parcel
- • Regional detention + water quality
- • Seller to bring all utilities to the site
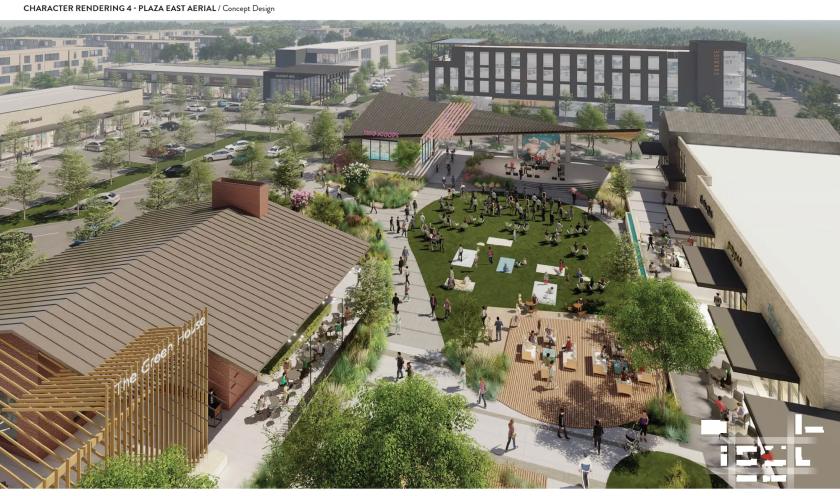
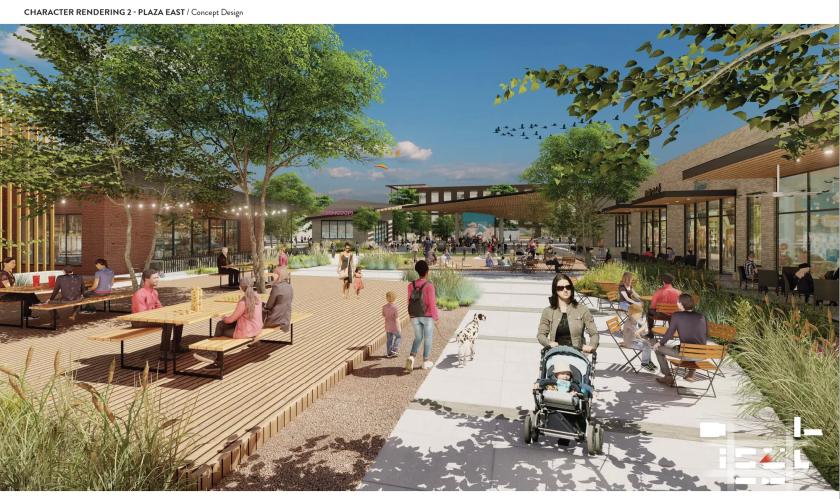
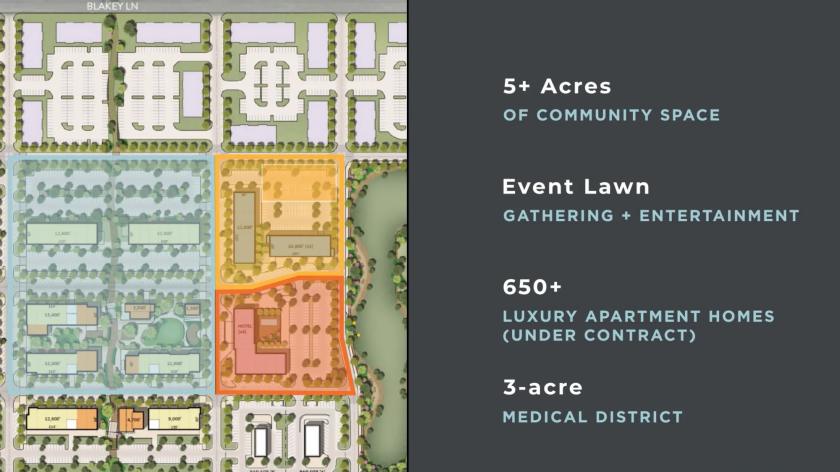
- • 5+ Acres of Community Space
- • Event Lawn for Gathering & Entertainment
- • 650+ Luxury Apartment Homes (Under Contract)
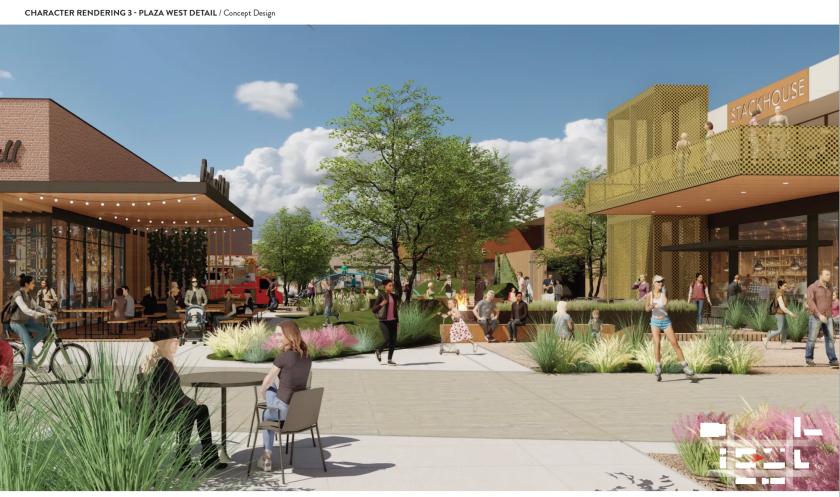
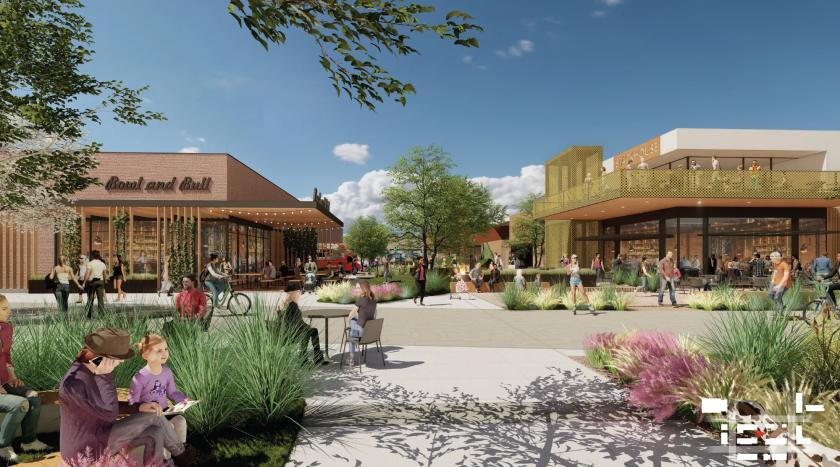
Additional Photos
Listing Agents

John T. Baird
O: 512-474-2411
M: 512-717-3085
john.baird@avisonyoung.com
O: 512-474-2411
M: 512-717-3085
john.baird@avisonyoung.com

Michael Kennedy
O: 214-269-3142
M: 972-814-4568
michael.kennedy@avisonyoung.com
O: 214-269-3142
M: 972-814-4568
michael.kennedy@avisonyoung.com

Sullivan Johnston
Avison Young
O: 512-474-2411
M: 843-224-1235
sullivan.johnston@avisonyoung.com
Avison Young
O: 512-474-2411
M: 843-224-1235
sullivan.johnston@avisonyoung.com
While we strive to provide the most accurate information, all listing information, and demographic data, is provided by third-parties. As such, MyEListing will not be responsible for the accuracy of the information. It is strongly recommended that you verify all information with the listing agent, and any relevant agencies, prior to making any decisions.