Retail Space
208 West 4th Street Austin, TX 78701
208 West 4th Street Austin, TX 78701

Details & Description
Property Highlights
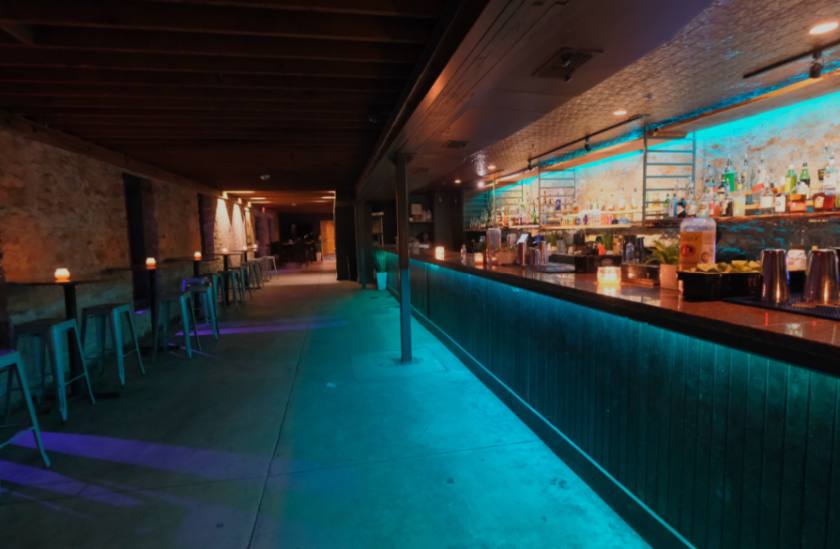
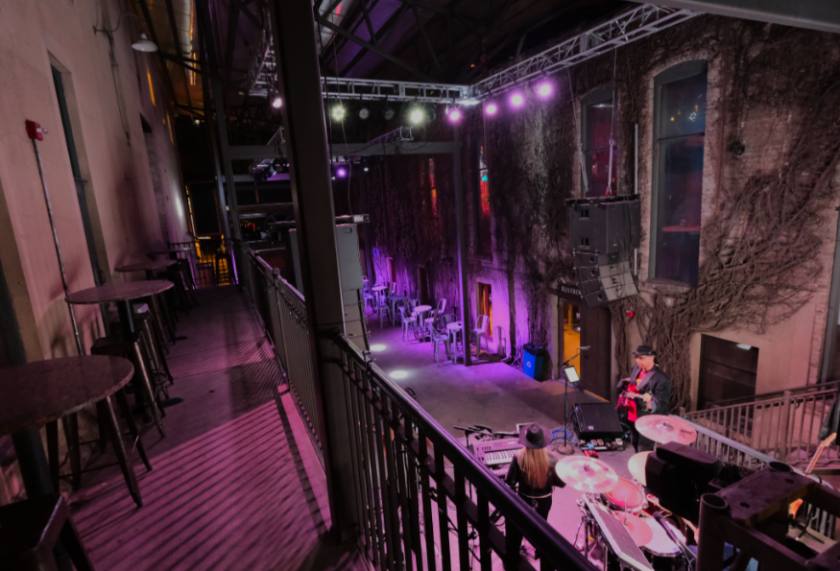
• 3 Bars; two large main bars - on each side of the main concert hall area, and one smaller bar on the right side.
• Lease Terms: Current Lease Through 5/31/27 plus a 5 year Option through 5/31/32.
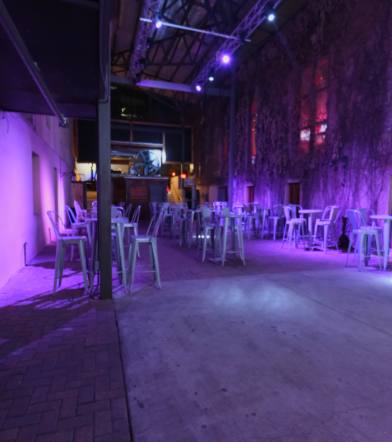
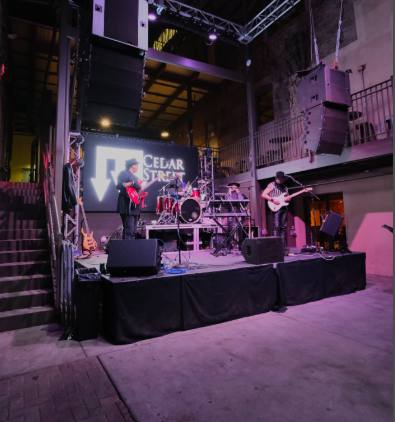
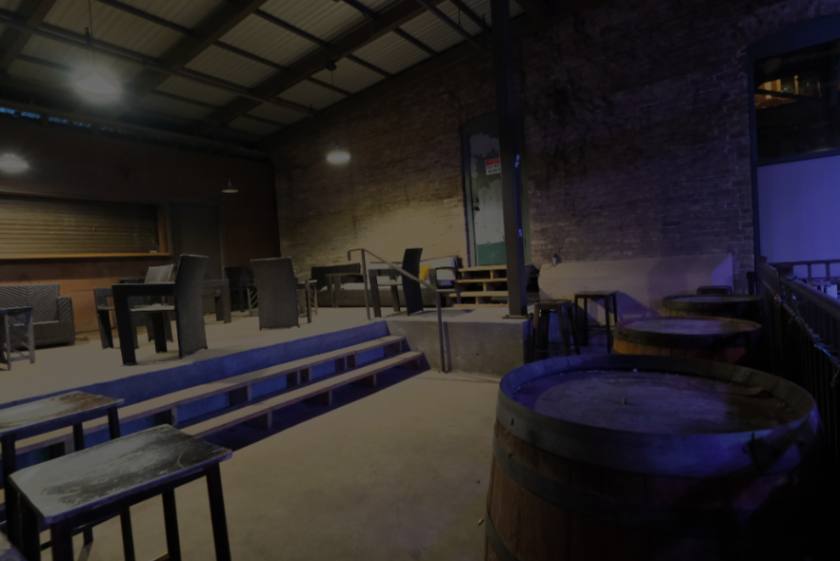
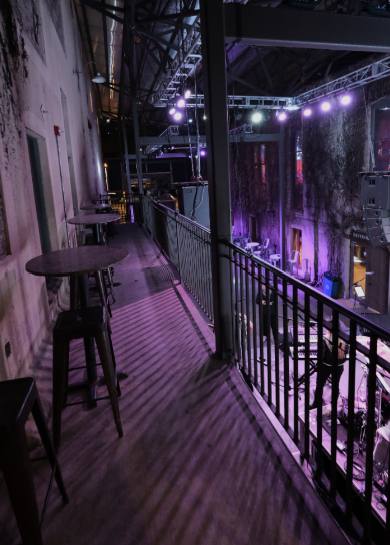
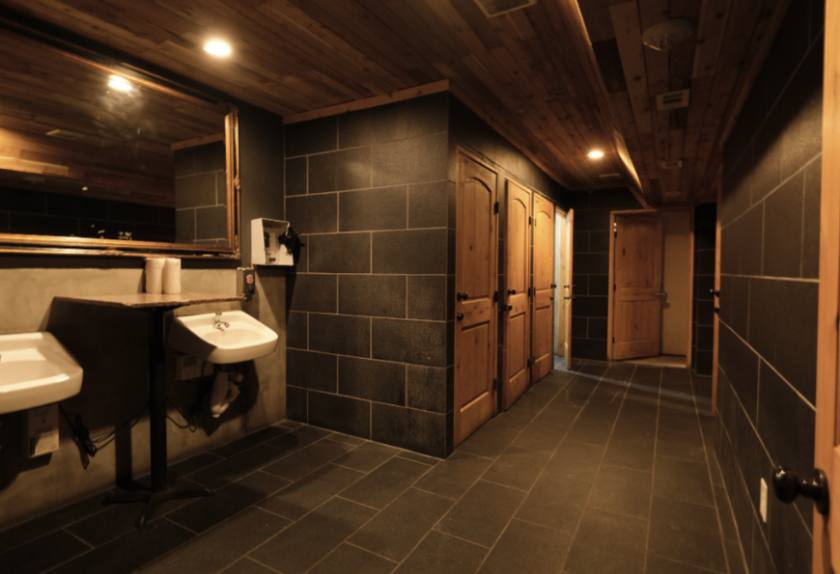
Additional Photos


Listing Agents

Jennifer Bernstein
O: 512-912-1070
M: 512-774-9520
jennifer@cmeatx.com
O: 512-912-1070
M: 512-774-9520
jennifer@cmeatx.com
While we strive to provide the most accurate information, all listing information, and demographic data, is provided by third-parties. As such, MyEListing will not be responsible for the accuracy of the information. It is strongly recommended that you verify all information with the listing agent, and any relevant agencies, prior to making any decisions.