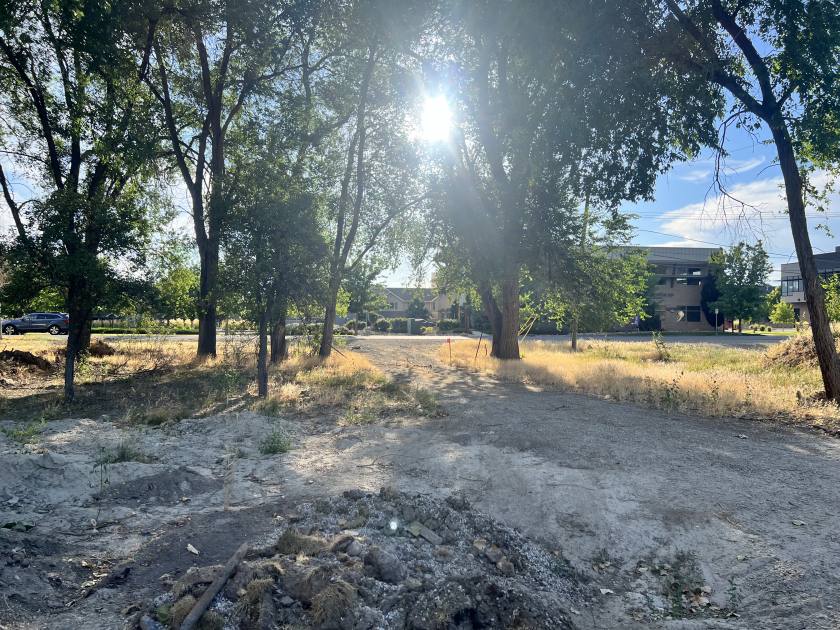
1-Mile | 3-Miles | 5-Miles | ||
---|---|---|---|---|
Total Population | 15,099 | 84,163 | 213,013 | |
Population Median Age | 35 | 35 | 36 | |
Population by Age | 0-9 Yrs | 2223 (14%) | 12043 (14%) | 31491 (14%) |
10-19 Yrs | 2695 (17%) | 14124 (16%) | 32450 (15%) | |
20-29 Yrs | 1776 (11%) | 10844 (12%) | 27854 (13%) | |
30-39 Yrs | 1957 (12%) | 11019 (13%) | 30248 (14%) | |
40-49 Yrs | 2151 (14%) | 12307 (14%) | 27822 (13%) | |
50-59 Yrs | 1816 (12%) | 9606 (11%) | 25004 (11%) | |
60-69 Yrs | 1390 (9%) | 8079 (9%) | 21467 (10%) | |
70+ Yrs | 1092 (7%) | 6140 (7%) | 16678 (7%) | |
Median HH Income | $102,946 | $103,487 | $96,678 | |
Total Household Income | < 24K | 264 (5%) | 2008 (7%) | 5931 (8%) |
25-49K | 509 (10%) | 3159 (11%) | 8187 (12%) | |
50-74K | 825 (17%) | 4032 (15%) | 11418 (16%) | |
75-99K | 651 (13%) | 3523 (13%) | 9781 (14%) | |
100-199K | 1857 (39%) | 9537 (36%) | 23692 (34%) | |
200K+ | 571 (12%) | 4199 (15%) | 9027 (13%) | |
Highest Education Level | No Diploma | 328 | 2282 | 6847 |
Diploma or GED | 1506 | 8675 | 24826 | |
Some College | 2545 | 13477 | 34284 | |
Assoc. Degree | 1163 | 5567 | 13983 | |
Bachelors Degree | 2363 | 15541 | 37582 | |
Higher Degree | 1475 | 7939 | 19230 | |
Total Housing Units | 4,906 | 27,514 | 70,788 | |
--Owner-Occupied | 3,635 | 21,111 | 52,452 | |
--Renter-Occupied | 1,042 | 5,348 | 15,584 | |
Owner-Occupied Values | < 100K | 166 | 537 | 1043 |
100-199K | 92 | 555 | 1876 | |
200-299K | 738 | 4599 | 10121 | |
300-399K | 1202 | 4830 | 14213 | |
400-499K | 756 | 3538 | 9625 | |
500K+ | 681 | 7052 | 15575 | |
Total Working Age Population | 11,124 | 62,725 | 160,763 | |
In Work Force | 7,838 | 43,765 | 110,092 | |
Not In Work Force | 3,287 | 18,960 | 50,671 | |
Workforce Employed | 7,687 | 42,471 | 106,385 | |
Workforce Unemployed | 142 | 1,252 | 3,641 | |
Civlian Workforce | 7,829 | 43,723 | 110,026 | |
Military Workforce | 8 | 42 | 67 | |
Total Households | 4,677 | 26,458 | 68,036 | |
Family Households | 3,877 | 21,199 | 52,928 | |
Non-Family Households | 799 | 5,259 | 15,108 | |
Married Couple | 3,111 | 18,158 | 44,578 | |
Other Family | 766 | 3,041 | 8,350 | |
Married w/Child | 1,550 | 8,636 | 20,403 | |
Single Male w/Child | 142 | 588 | 1,399 | |
Single Female w/Child | 234 | 798 | 2,472 |
Population Change Last Two Decades - Plus Projection
2000 | % | 2010 | % | 2020 | % | 2030 | |
---|---|---|---|---|---|---|---|
Utah | 2,233,169 | +24 | 2,763,885 | +20 | 3,325,425 | +17 | 3,889,310 |
Salt Lake County | 898,387 | +15 | 1,029,655 | +15 | 1,181,471 | +11 | 1,306,414 |
Utah County | 368,536 | +40 | 516,564 | +31 | 679,188 | +27 | 861,852 |
Total Working Age Population:
Total Households:
Total Working Age Population:
Total Households:
Total Working Age Population:
Total Households: