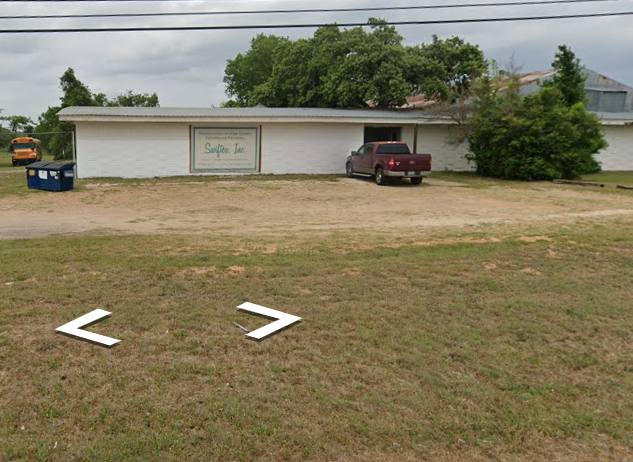
1-Mile | 3-Miles | 5-Miles | ||
---|---|---|---|---|
Total Population | 2,180 | 8,475 | 17,071 | |
Population Median Age | 33 | 38 | 38 | |
Population by Age | 0-9 Yrs | 424 (19%) | 1163 (13%) | 2264 (13%) |
10-19 Yrs | 354 (16%) | 1322 (15%) | 2513 (14%) | |
20-29 Yrs | 195 (8%) | 922 (10%) | 2055 (12%) | |
30-39 Yrs | 365 (16%) | 933 (11%) | 2147 (12%) | |
40-49 Yrs | 321 (14%) | 1312 (15%) | 2448 (14%) | |
50-59 Yrs | 261 (11%) | 896 (10%) | 1885 (11%) | |
60-69 Yrs | 155 (7%) | 940 (11%) | 1907 (11%) | |
70+ Yrs | 105 (4%) | 987 (11%) | 1853 (10%) | |
Median HH Income | $39,598 | $46,453 | $61,263 | |
Total Household Income | < 24K | 218 (32%) | 874 (29%) | 1324 (23%) |
25-49K | 130 (19%) | 682 (22%) | 1149 (20%) | |
50-74K | 70 (10%) | 353 (11%) | 728 (12%) | |
75-99K | 34 (5%) | 213 (7%) | 654 (11%) | |
100-199K | 206 (30%) | 669 (22%) | 1448 (25%) | |
200K+ | 19 (2%) | 189 (6%) | 361 (6%) | |
Highest Education Level | No Diploma | 195 | 815 | 1646 |
Diploma or GED | 303 | 1412 | 3071 | |
Some College | 197 | 1020 | 2379 | |
Assoc. Degree | 137 | 393 | 713 | |
Bachelors Degree | 344 | 1190 | 2332 | |
Higher Degree | 120 | 556 | 1078 | |
Total Housing Units | 728 | 3,292 | 6,378 | |
--Owner-Occupied | 511 | 2,139 | 3,995 | |
--Renter-Occupied | 166 | 841 | 1,670 | |
Owner-Occupied Values | < 100K | 119 | 319 | 607 |
100-199K | 79 | 491 | 1051 | |
200-299K | 266 | 912 | 1450 | |
300-399K | 10 | 183 | 388 | |
400-499K | 30 | 141 | 280 | |
500K+ | 6 | 93 | 219 | |
Total Working Age Population | 1,481 | 6,466 | 13,288 | |
In Work Force | 799 | 3,500 | 7,276 | |
Not In Work Force | 682 | 2,966 | 6,013 | |
Workforce Employed | 799 | 3,425 | 7,038 | |
Workforce Unemployed | 0 | 75 | 237 | |
Civlian Workforce | 799 | 3,500 | 7,276 | |
Military Workforce | 0 | 0 | 0 | |
Total Households | 677 | 2,980 | 5,665 | |
Family Households | 593 | 2,040 | 3,920 | |
Non-Family Households | 84 | 940 | 1,745 | |
Married Couple | 349 | 1,482 | 3,065 | |
Other Family | 244 | 558 | 855 | |
Married w/Child | 263 | 834 | 1,528 | |
Single Male w/Child | 0 | 4 | 37 | |
Single Female w/Child | 84 | 206 | 331 |
Population Change Last Two Decades - Plus Projection
2000 | % | 2010 | % | 2020 | % | 2030 | |
---|---|---|---|---|---|---|---|
Texas | 20,851,820 | +21 | 25,145,561 | +18 | 29,677,668 | +18 | 34,894,452 |
Bastrop County | 57,733 | +28 | 74,171 | +16 | 86,105 | +15 | 99,211 |
Total Working Age Population:
Total Households:
Total Working Age Population:
Total Households:
Total Working Age Population:
Total Households: