Commercial Land
0 Emerald Pkwy Dublin, OH 43016
0 Emerald Pkwy Dublin, OH 43016
Details & Description
Property Highlights
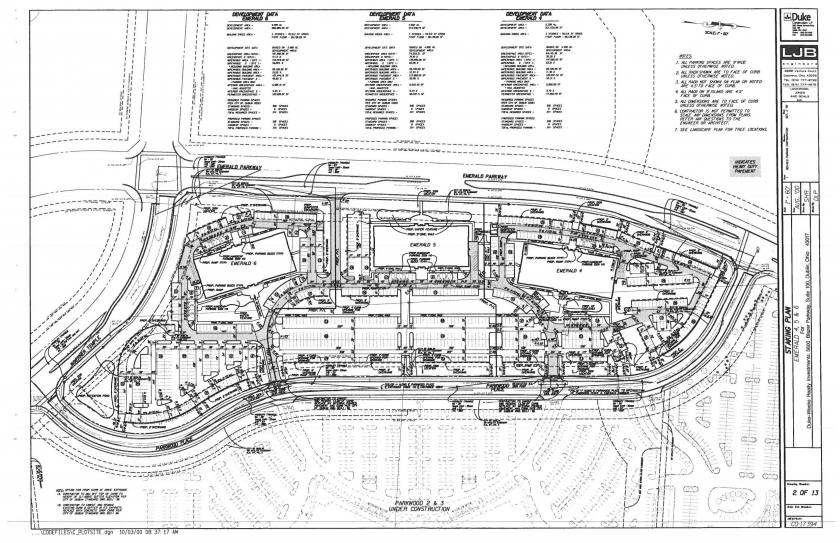
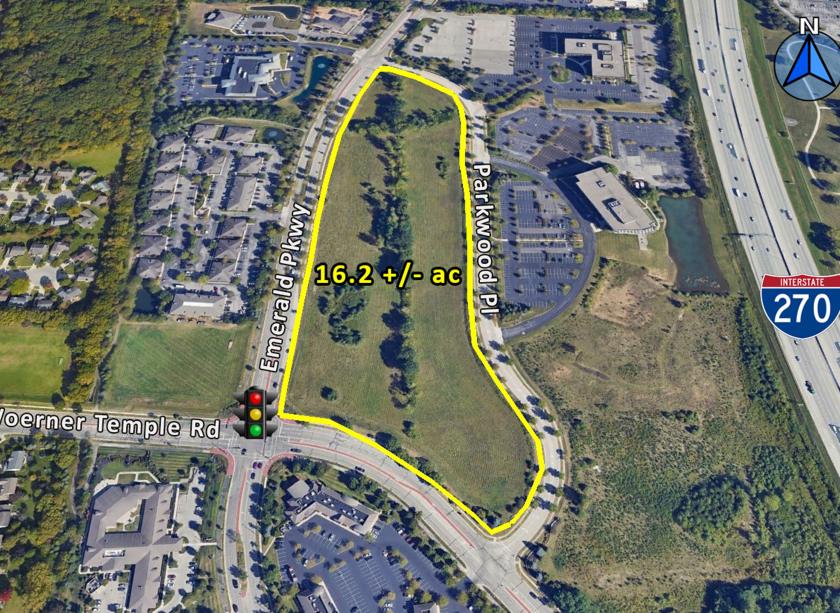
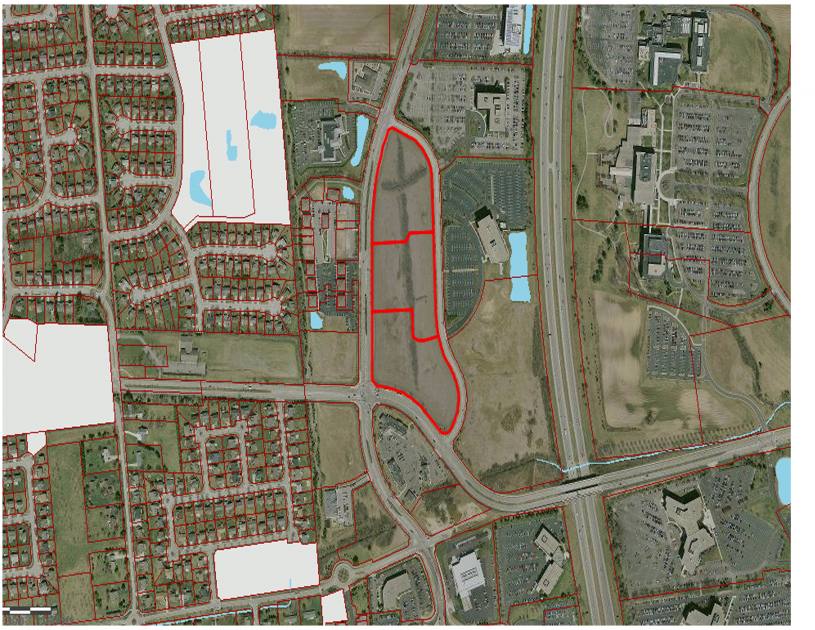
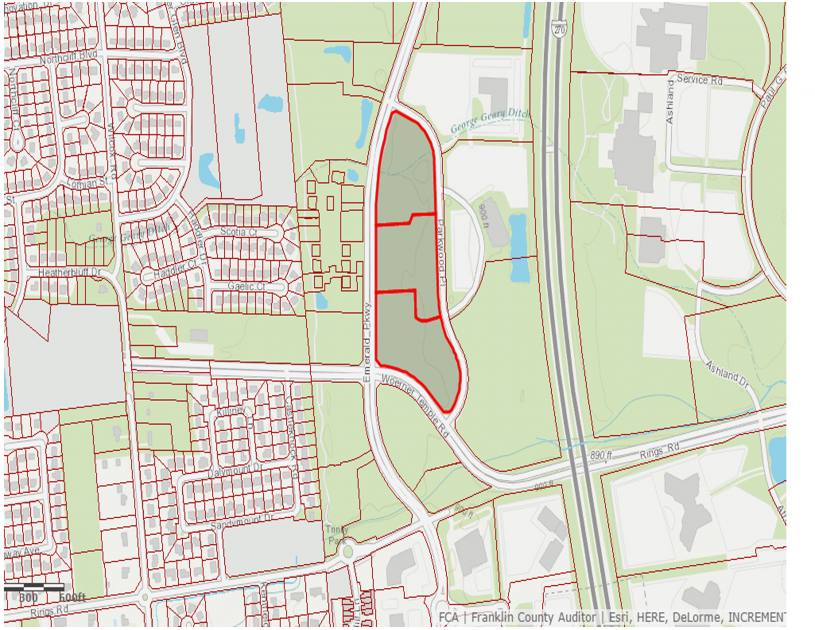
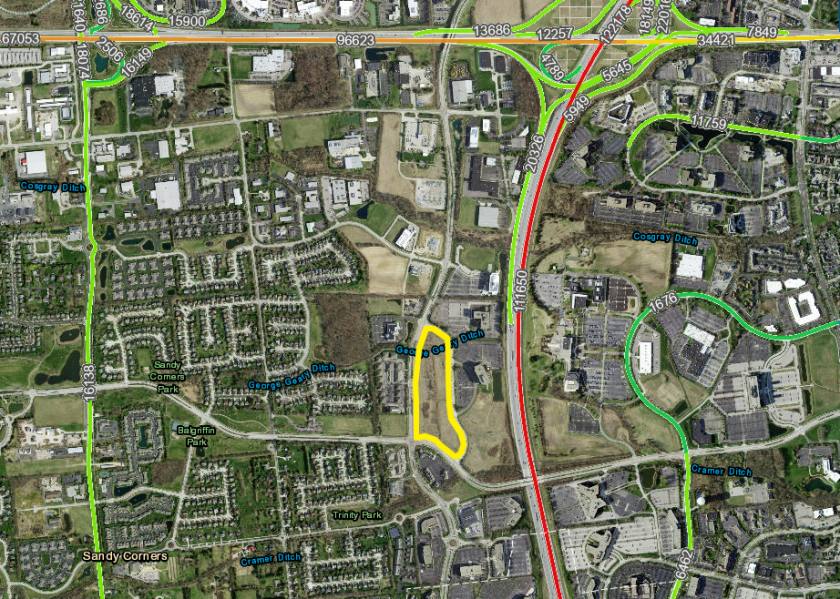
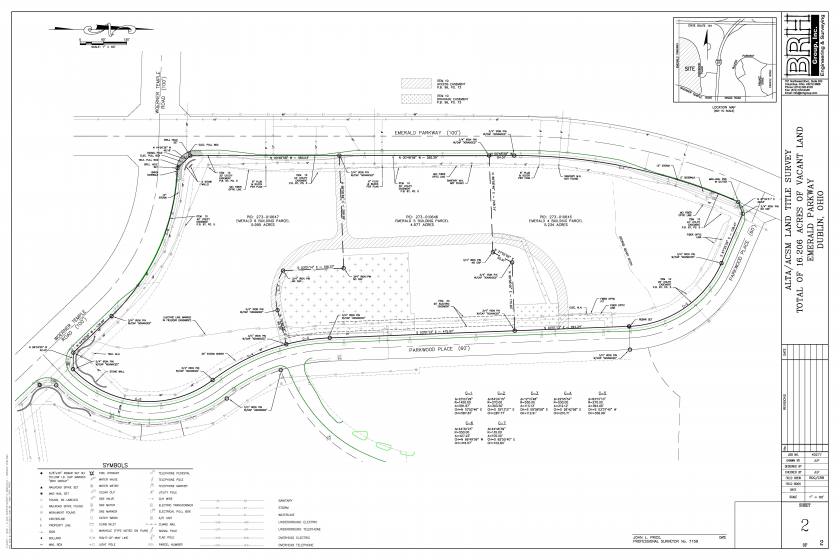
- • DUBLIN LAND DEVELOPMENT OPPORTUNITY
- • IDEAL LOCATION FOR CORPORATE HEADQUARTERS
- • EASY ACCESS TO I-270
- • EMERALD CORPORATE DISTRICT
Additional Photos
Listing Agents

Skip Weiler
O: 614-221-4286
skip@rweiler.com
O: 614-221-4286
skip@rweiler.com
While we strive to provide the most accurate information, all listing information, and demographic data, is provided by third-parties. As such, MyEListing will not be responsible for the accuracy of the information. It is strongly recommended that you verify all information with the listing agent, and any relevant agencies, prior to making any decisions.