Commercial Land
Pin Oak Road and Katy Freeway Katy, TX 77494
Pin Oak Road and Katy Freeway Katy, TX 77494
Details & Description
Property Highlights
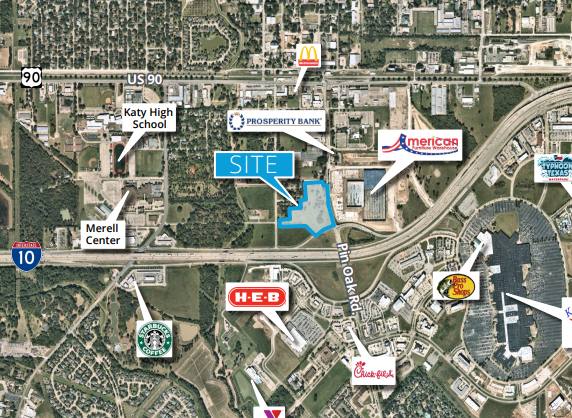
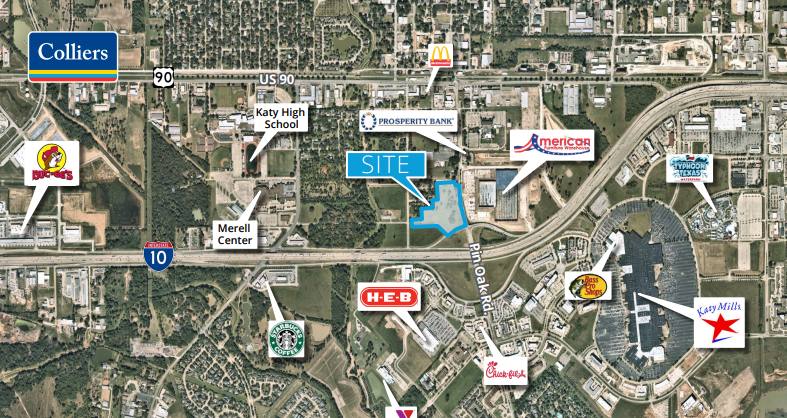
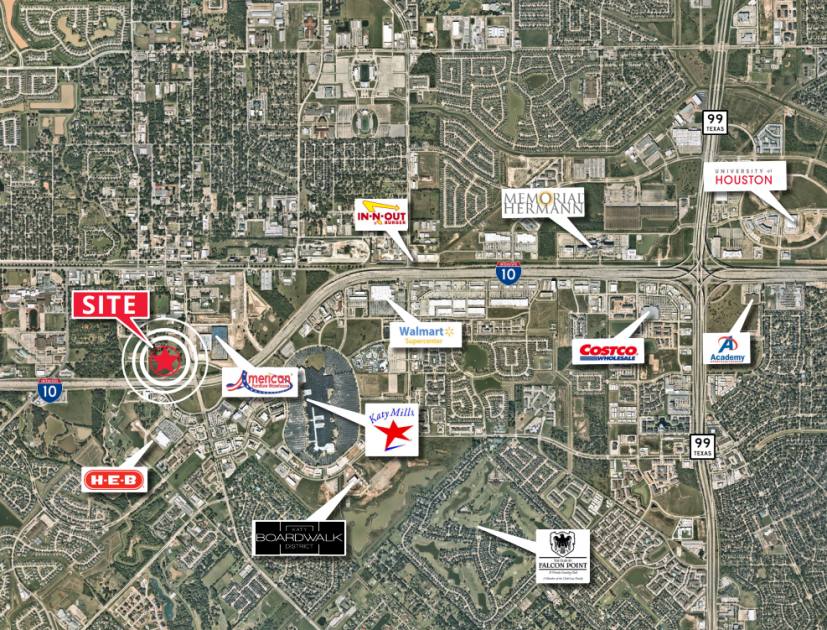
• Ideal site for retail development in one of Houston’s fastest growings suburbs in northern Fort Bend County
• At northwest corner of heavily-traveled I-10 and Pin Oak Rd across from Katy Mills Mall; American Furniture
Additional Photos

Listing Agents

Bill Byrd
O: 713-830-2131
M: 713-628-2022
bill.byrd@colliers.com
O: 713-830-2131
M: 713-628-2022
bill.byrd@colliers.com
While we strive to provide the most accurate information, all listing information, and demographic data, is provided by third-parties. As such, MyEListing will not be responsible for the accuracy of the information. It is strongly recommended that you verify all information with the listing agent, and any relevant agencies, prior to making any decisions.


