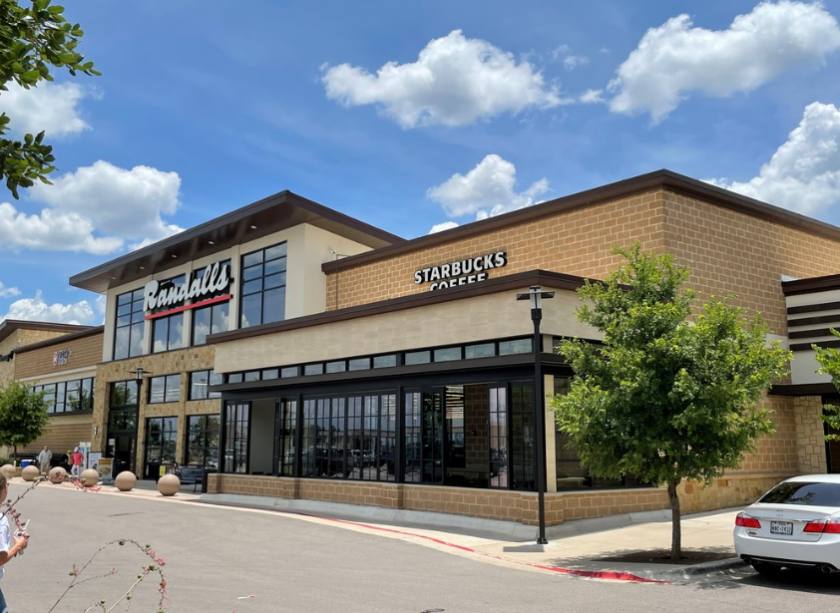
Retail Space
5731 Williams Drive Georgetown, TX 78633
5731 Williams Drive Georgetown, TX 78633
Details & Description
Property Highlights
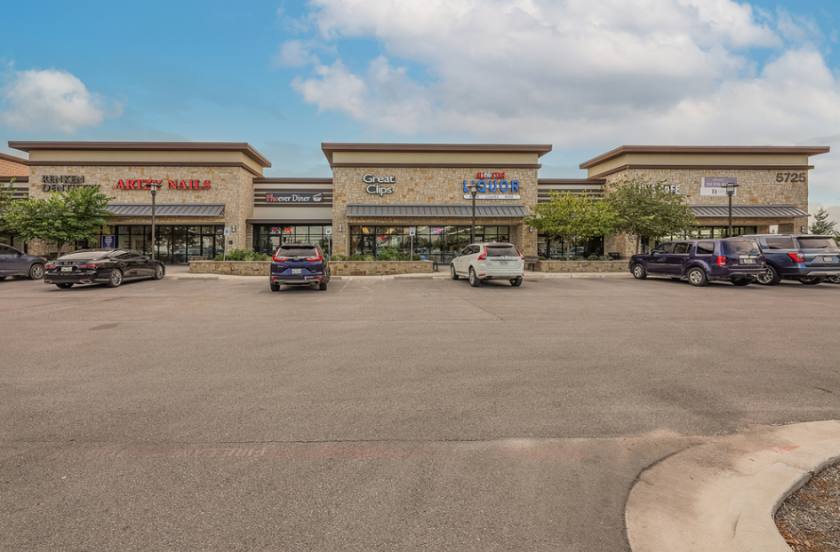
• The property is currently 92% leased with a diverse mix of restaurants and service-oriented tenants comprising
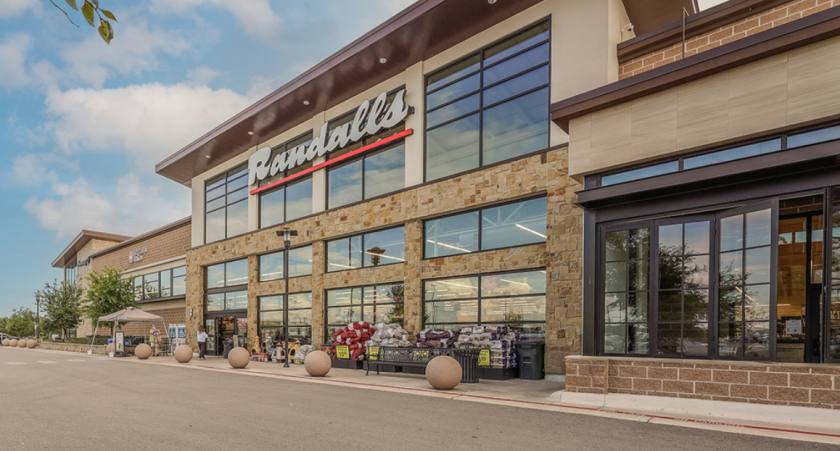
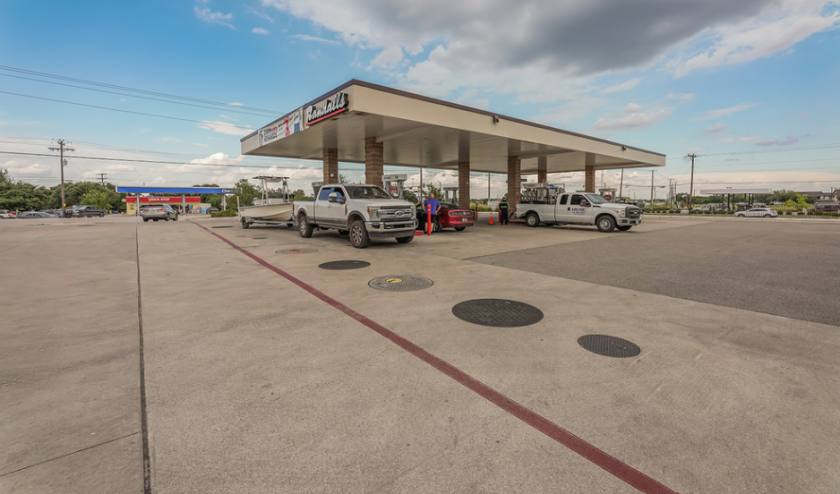
• Randall's anchored retail development
Additional Photos

Listing Agents

Adelaide Ehrlich
O: 512-236-4649
M: 512-236-4649
adelaide.ehrlich@srsre.com
O: 512-236-4649
M: 512-236-4649
adelaide.ehrlich@srsre.com

Carson Hawley
O: 512-236-4620
M: 512-422-9977
carson.hawley@srsre.com
O: 512-236-4620
M: 512-422-9977
carson.hawley@srsre.com
While we strive to provide the most accurate information, all listing information, and demographic data, is provided by third-parties. As such, MyEListing will not be responsible for the accuracy of the information. It is strongly recommended that you verify all information with the listing agent, and any relevant agencies, prior to making any decisions.


