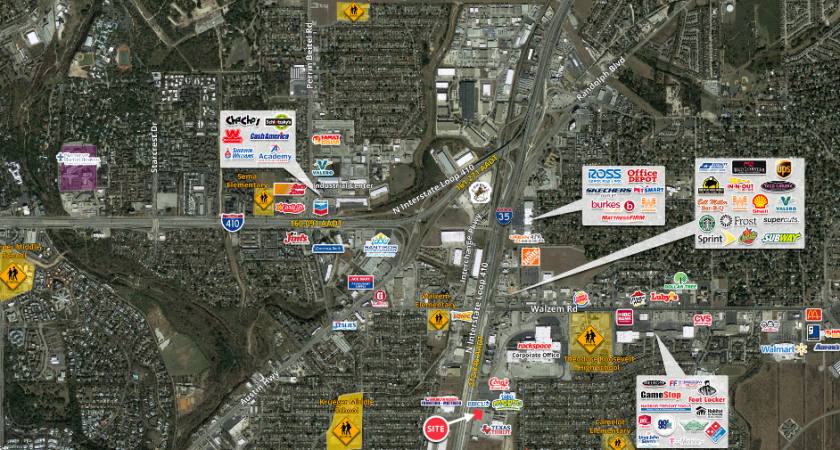
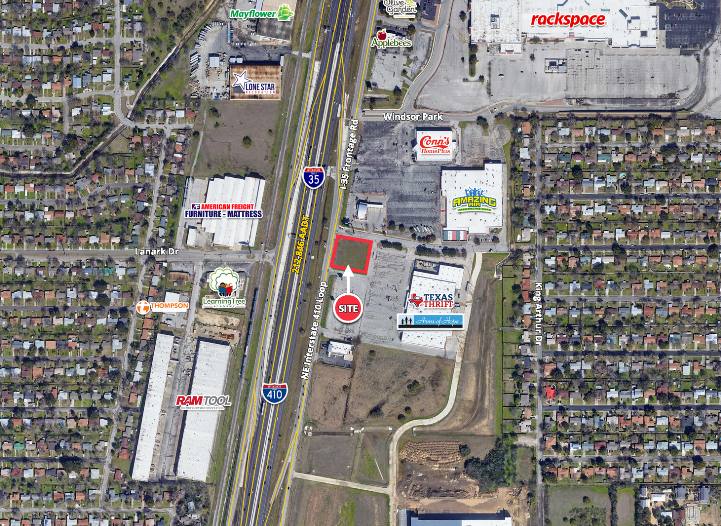
1-Mile | 3-Miles | 5-Miles | ||
---|---|---|---|---|
Total Population | 12,005 | 100,284 | 256,449 | |
Population Median Age | 37 | 37 | 37 | |
Population by Age | 0-9 Yrs | 1928 (16%) | 14635 (14%) | 35794 (13%) |
10-19 Yrs | 1219 (10%) | 12114 (12%) | 35329 (13%) | |
20-29 Yrs | 1784 (14%) | 15081 (15%) | 37001 (14%) | |
30-39 Yrs | 1953 (16%) | 14801 (14%) | 37582 (14%) | |
40-49 Yrs | 1299 (10%) | 11211 (11%) | 30150 (11%) | |
50-59 Yrs | 1331 (11%) | 12652 (12%) | 31096 (12%) | |
60-69 Yrs | 1303 (10%) | 10354 (10%) | 26366 (10%) | |
70+ Yrs | 1188 (9%) | 9437 (9%) | 23131 (9%) | |
Median HH Income | $42,629 | $47,432 | $58,053 | |
Total Household Income | < 24K | 1021 (25%) | 8375 (23%) | 15918 (18%) |
25-49K | 1329 (33%) | 10309 (28%) | 21184 (24%) | |
50-74K | 753 (19%) | 6909 (19%) | 18548 (21%) | |
75-99K | 281 (7%) | 3928 (11%) | 11582 (13%) | |
100-199K | 502 (12%) | 4864 (13%) | 15178 (17%) | |
200K+ | 49 (1%) | 1245 (3%) | 5103 (5%) | |
Highest Education Level | No Diploma | 1408 | 9196 | 19892 |
Diploma or GED | 2634 | 19253 | 42661 | |
Some College | 2069 | 16700 | 42656 | |
Assoc. Degree | 734 | 6155 | 15377 | |
Bachelors Degree | 978 | 9763 | 29542 | |
Higher Degree | 290 | 5999 | 18328 | |
Total Housing Units | 4,317 | 38,989 | 95,211 | |
--Owner-Occupied | 2,132 | 17,730 | 50,649 | |
--Renter-Occupied | 1,803 | 17,899 | 36,864 | |
Owner-Occupied Values | < 100K | 809 | 4121 | 9083 |
100-199K | 1232 | 8880 | 26822 | |
200-299K | 55 | 2396 | 6877 | |
300-399K | 12 | 1353 | 2681 | |
400-499K | 25 | 603 | 1482 | |
500K+ | 0 | 378 | 3704 | |
Total Working Age Population | 9,226 | 78,205 | 198,380 | |
In Work Force | 6,010 | 50,734 | 129,144 | |
Not In Work Force | 3,216 | 27,471 | 69,237 | |
Workforce Employed | 5,401 | 46,616 | 120,006 | |
Workforce Unemployed | 537 | 2,616 | 6,141 | |
Civlian Workforce | 5,937 | 49,232 | 126,147 | |
Military Workforce | 73 | 1,502 | 2,997 | |
Total Households | 3,935 | 35,630 | 87,513 | |
Family Households | 2,392 | 21,028 | 55,333 | |
Non-Family Households | 1,543 | 14,602 | 32,180 | |
Married Couple | 1,334 | 13,635 | 36,967 | |
Other Family | 1,059 | 7,392 | 18,366 | |
Married w/Child | 494 | 5,671 | 15,198 | |
Single Male w/Child | 94 | 665 | 1,888 | |
Single Female w/Child | 371 | 3,207 | 7,942 |
Population Change Last Two Decades - Plus Projection
2000 | % | 2010 | % | 2020 | % | 2030 | |
---|---|---|---|---|---|---|---|
Texas | 20,851,820 | +21 | 25,145,561 | +18 | 29,677,668 | +18 | 34,894,452 |
Bexar County | 1,392,931 | +23 | 1,714,773 | +22 | 2,093,502 | +20 | 2,502,617 |
Total Working Age Population:
Total Households:
Total Working Age Population:
Total Households:
Total Working Age Population:
Total Households: