Commercial Land
I-35 and Slaughter Ln Austin, TX 78744
I-35 and Slaughter Ln Austin, TX 78744
Details & Description
Property Highlights
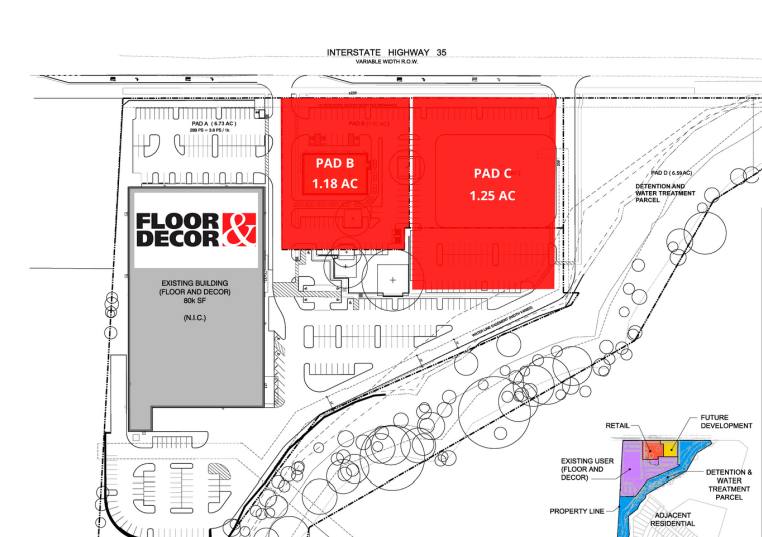
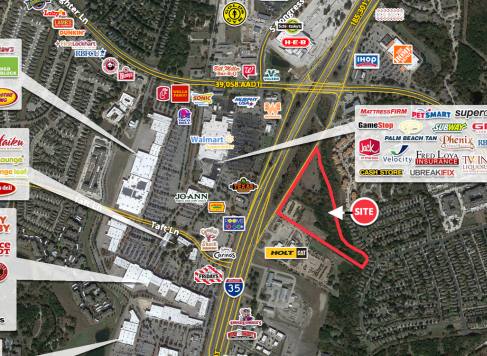
- • IH 35 Frontage
- • High traffic counts
- • Across from Southpark Meadows Shopping Center
Listing Agents

Will Majors
O: 512-236-4646
will.majors@srsre.com
O: 512-236-4646
will.majors@srsre.com
While we strive to provide the most accurate information, all listing information, and demographic data, is provided by third-parties. As such, MyEListing will not be responsible for the accuracy of the information. It is strongly recommended that you verify all information with the listing agent, and any relevant agencies, prior to making any decisions.