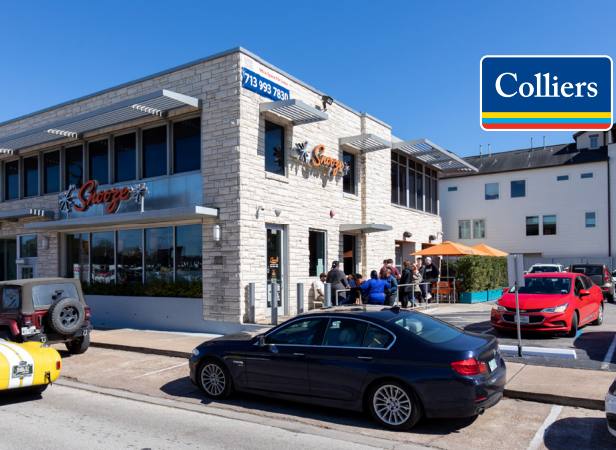
1-Mile | 3-Miles | 5-Miles | ||
---|---|---|---|---|
Total Population | 31,222 | 184,961 | 437,316 | |
Population Median Age | 38 | 37 | 37 | |
Population by Age | 0-9 Yrs | 1642 (5%) | 15196 (8%) | 42737 (9%) |
10-19 Yrs | 1291 (4%) | 12285 (6%) | 36589 (8%) | |
20-29 Yrs | 9049 (28%) | 46086 (24%) | 93895 (21%) | |
30-39 Yrs | 7297 (23%) | 41039 (22%) | 86509 (19%) | |
40-49 Yrs | 3709 (11%) | 21916 (11%) | 53880 (12%) | |
50-59 Yrs | 3650 (11%) | 19930 (10%) | 48509 (11%) | |
60-69 Yrs | 2653 (8%) | 16843 (9%) | 41684 (9%) | |
70+ Yrs | 1931 (6%) | 11667 (6%) | 33514 (7%) | |
Median HH Income | $87,200 | $94,892 | $81,599 | |
Total Household Income | < 24K | 2586 (14%) | 12720 (14%) | 34564 (17%) |
25-49K | 2405 (13%) | 10848 (11%) | 30881 (15%) | |
50-74K | 3102 (17%) | 13470 (14%) | 29277 (14%) | |
75-99K | 2023 (11%) | 10429 (11%) | 21101 (10%) | |
100-199K | 4693 (25%) | 23075 (25%) | 44951 (22%) | |
200K+ | 3351 (18%) | 20132 (22%) | 39814 (19%) | |
Highest Education Level | No Diploma | 415 | 5851 | 29065 |
Diploma or GED | 1734 | 12514 | 39084 | |
Some College | 3281 | 16228 | 40887 | |
Assoc. Degree | 1078 | 5765 | 14059 | |
Bachelors Degree | 9383 | 50938 | 102301 | |
Higher Degree | 8888 | 47971 | 95466 | |
Total Housing Units | 20,800 | 104,490 | 230,302 | |
--Owner-Occupied | 6,473 | 36,141 | 87,023 | |
--Renter-Occupied | 11,687 | 54,533 | 113,565 | |
Owner-Occupied Values | < 100K | 101 | 1043 | 7216 |
100-199K | 368 | 2540 | 10865 | |
200-299K | 759 | 4274 | 9826 | |
300-399K | 1045 | 7328 | 13456 | |
400-499K | 1110 | 4724 | 10298 | |
500K+ | 3091 | 16232 | 35362 | |
Total Working Age Population | 28,795 | 163,630 | 374,141 | |
In Work Force | 22,898 | 116,459 | 256,665 | |
Not In Work Force | 5,897 | 47,170 | 117,476 | |
Workforce Employed | 22,152 | 111,391 | 244,249 | |
Workforce Unemployed | 746 | 4,897 | 12,187 | |
Civlian Workforce | 22,898 | 116,287 | 256,436 | |
Military Workforce | 0 | 172 | 229 | |
Total Households | 18,161 | 90,673 | 200,588 | |
Family Households | 5,582 | 35,239 | 91,327 | |
Non-Family Households | 12,579 | 55,434 | 109,261 | |
Married Couple | 4,564 | 28,500 | 69,306 | |
Other Family | 1,018 | 6,740 | 22,021 | |
Married w/Child | 1,043 | 8,760 | 24,521 | |
Single Male w/Child | 189 | 792 | 2,304 | |
Single Female w/Child | 275 | 2,062 | 7,420 |
Population Change Last Two Decades - Plus Projection
2000 | % | 2010 | % | 2020 | % | 2030 | |
---|---|---|---|---|---|---|---|
Texas | 20,851,820 | +21 | 25,145,561 | +18 | 29,677,668 | +18 | 34,894,452 |
Harris County | 3,400,578 | +20 | 4,092,459 | +22 | 4,978,845 | +19 | 5,924,750 |
Total Working Age Population:
Total Households:
Total Working Age Population:
Total Households:
Total Working Age Population:
Total Households: