Specialty Real Estate
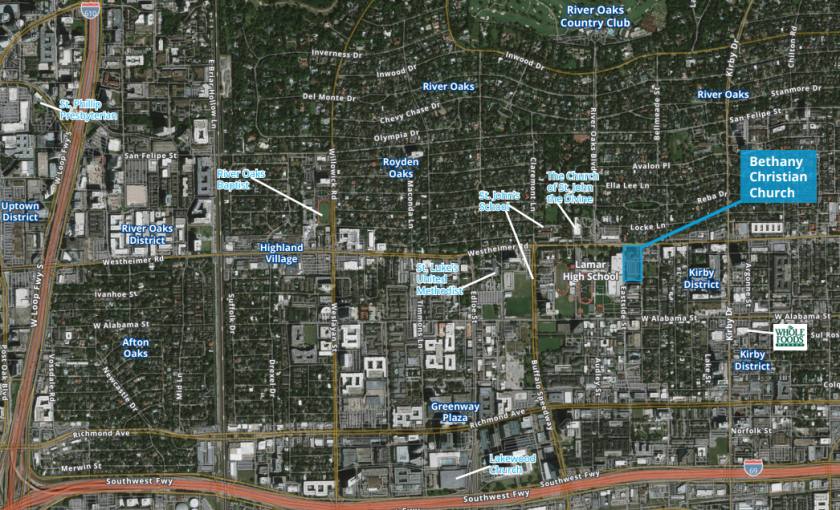
3223 Westheimer Road Houston, TX 77098
3223 Westheimer Road Houston, TX 77098

Details & Description
Property Highlights
- • Prime Inner Loop location on Westheimer Road
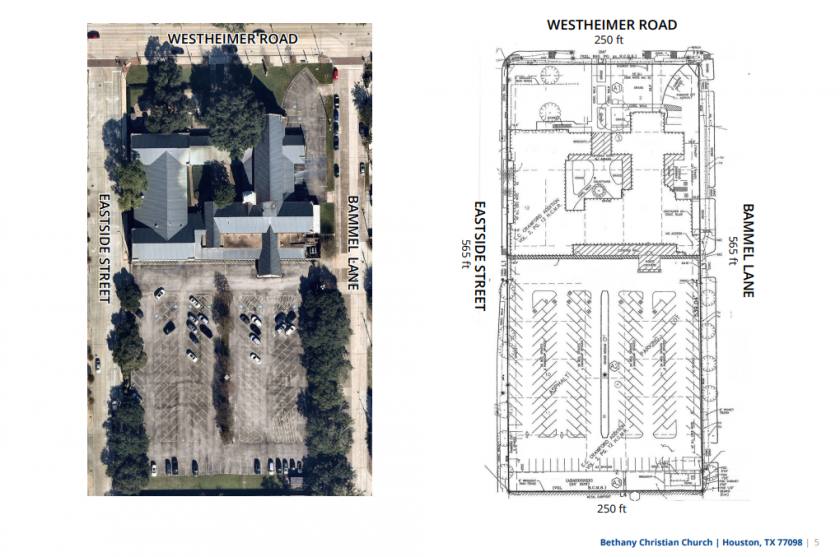
- • Sanctuary Seating Capacity: 631
- • On site gated parking lot, 174 parking spaces
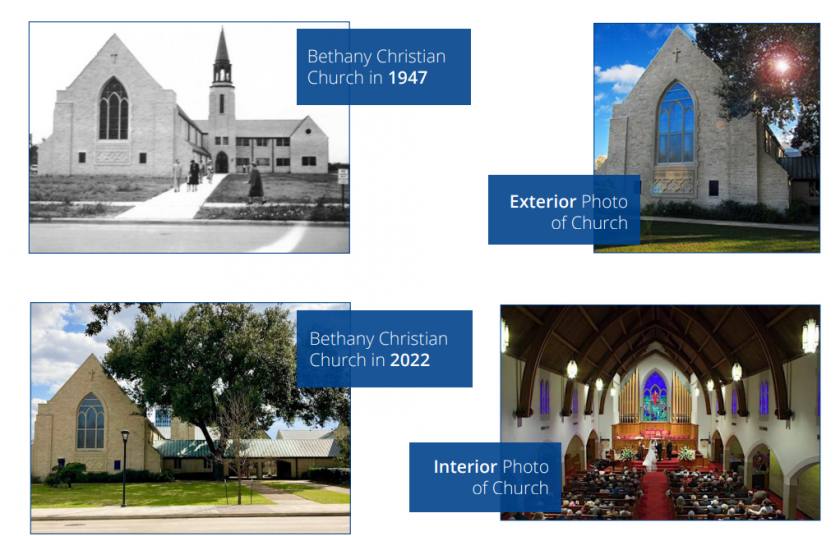
Additional Photos

Listing Agents

Bob Parsley
O: 713-830-2121
M: 713-501-3996
bob.parsley@colliers.com
O: 713-830-2121
M: 713-501-3996
bob.parsley@colliers.com
While we strive to provide the most accurate information, all listing information, and demographic data, is provided by third-parties. As such, MyEListing will not be responsible for the accuracy of the information. It is strongly recommended that you verify all information with the listing agent, and any relevant agencies, prior to making any decisions.