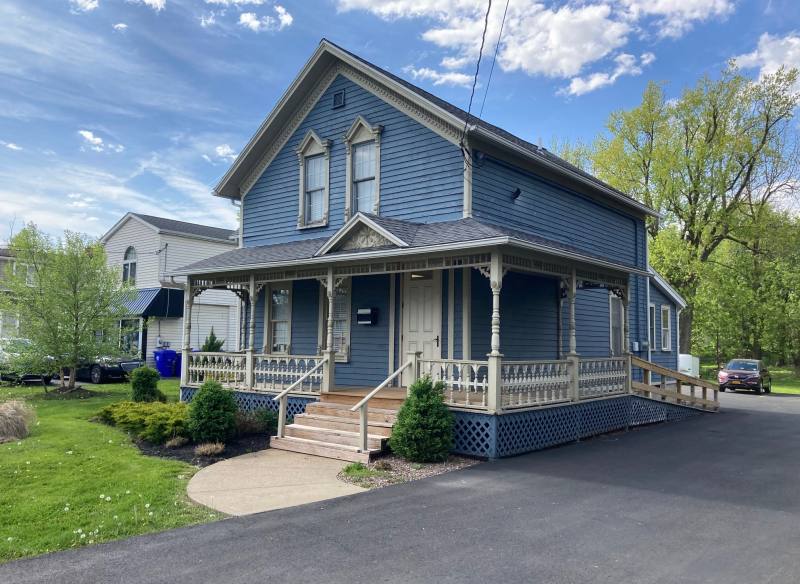
1-Mile | 3-Miles | 5-Miles | ||
---|---|---|---|---|
Total Population | 8,081 | 62,053 | 166,974 | |
Population Median Age | 43 | 43 | 42 | |
Population by Age | 0-9 Yrs | 696 (8%) | 6055 (9%) | 16992 (10%) |
10-19 Yrs | 901 (11%) | 6174 (9%) | 17204 (10%) | |
20-29 Yrs | 1096 (13%) | 8336 (13%) | 22426 (13%) | |
30-39 Yrs | 930 (11%) | 7587 (12%) | 21874 (13%) | |
40-49 Yrs | 856 (10%) | 6748 (10%) | 18029 (10%) | |
50-59 Yrs | 1357 (16%) | 9760 (15%) | 24966 (14%) | |
60-69 Yrs | 1090 (13%) | 8727 (14%) | 23286 (13%) | |
70+ Yrs | 1154 (14%) | 8666 (13%) | 22195 (13%) | |
Median HH Income | $76,074 | $64,685 | $58,746 | |
Total Household Income | < 24K | 356 (10%) | 4061 (14%) | 13767 (18%) |
25-49K | 578 (16%) | 6429 (23%) | 17264 (23%) | |
50-74K | 768 (22%) | 5394 (19%) | 14599 (19%) | |
75-99K | 796 (22%) | 4607 (16%) | 10797 (14%) | |
100-199K | 803 (23%) | 6166 (22%) | 15064 (20%) | |
200K+ | 172 (4%) | 939 (3%) | 2271 (3%) | |
Highest Education Level | No Diploma | 257 | 2763 | 9819 |
Diploma or GED | 1751 | 13800 | 39680 | |
Some College | 1029 | 8494 | 22932 | |
Assoc. Degree | 1126 | 7092 | 16984 | |
Bachelors Degree | 1073 | 8667 | 20465 | |
Higher Degree | 660 | 4849 | 12343 | |
Total Housing Units | 3,617 | 29,149 | 79,228 | |
--Owner-Occupied | 2,702 | 19,495 | 48,765 | |
--Renter-Occupied | 773 | 8,102 | 24,996 | |
Owner-Occupied Values | < 100K | 176 | 2898 | 12672 |
100-199K | 1889 | 11853 | 25105 | |
200-299K | 537 | 3637 | 6967 | |
300-399K | 65 | 751 | 2099 | |
400-499K | 2 | 106 | 769 | |
500K+ | 34 | 250 | 1154 | |
Total Working Age Population | 6,883 | 52,442 | 139,503 | |
In Work Force | 4,479 | 34,206 | 89,093 | |
Not In Work Force | 2,403 | 18,236 | 50,409 | |
Workforce Employed | 4,335 | 33,035 | 84,865 | |
Workforce Unemployed | 143 | 1,154 | 4,170 | |
Civlian Workforce | 4,479 | 34,189 | 89,035 | |
Military Workforce | 1 | 16 | 59 | |
Total Households | 3,474 | 27,597 | 73,761 | |
Family Households | 2,092 | 16,343 | 43,093 | |
Non-Family Households | 1,383 | 11,254 | 30,669 | |
Married Couple | 1,645 | 12,309 | 30,441 | |
Other Family | 446 | 4,034 | 12,651 | |
Married w/Child | 588 | 4,312 | 10,135 | |
Single Male w/Child | 81 | 473 | 1,475 | |
Single Female w/Child | 119 | 1,388 | 4,283 |
Population Change Last Two Decades - Plus Projection
2000 | % | 2010 | % | 2020 | % | 2030 | |
---|---|---|---|---|---|---|---|
New York | 18,976,457 | +2 | 19,378,102 | +4 | 20,146,131 | +2 | 20,604,030 |
Erie County | 950,265 | -3 | 919,040 | +2 | 936,084 | +1 | 949,073 |
Total Working Age Population:
Total Households:
Total Working Age Population:
Total Households:
Total Working Age Population:
Total Households: