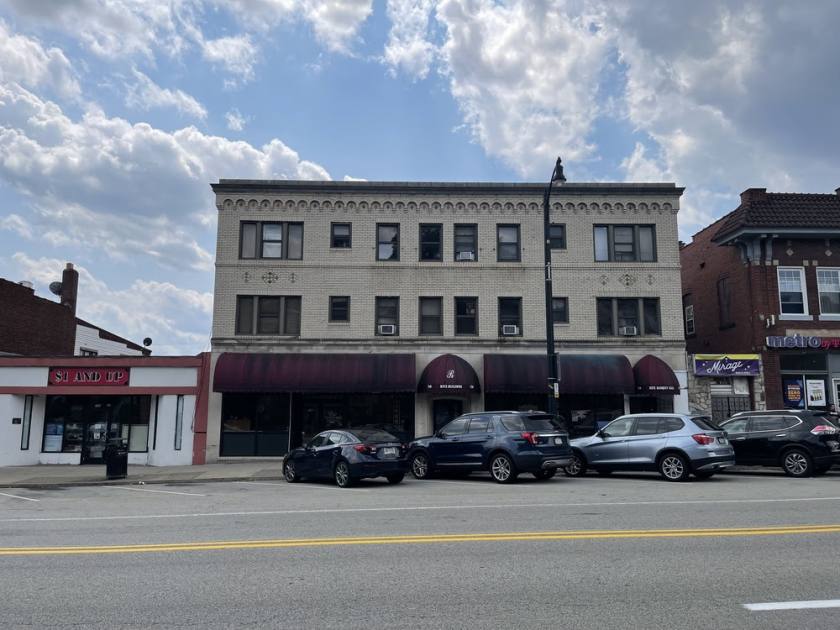
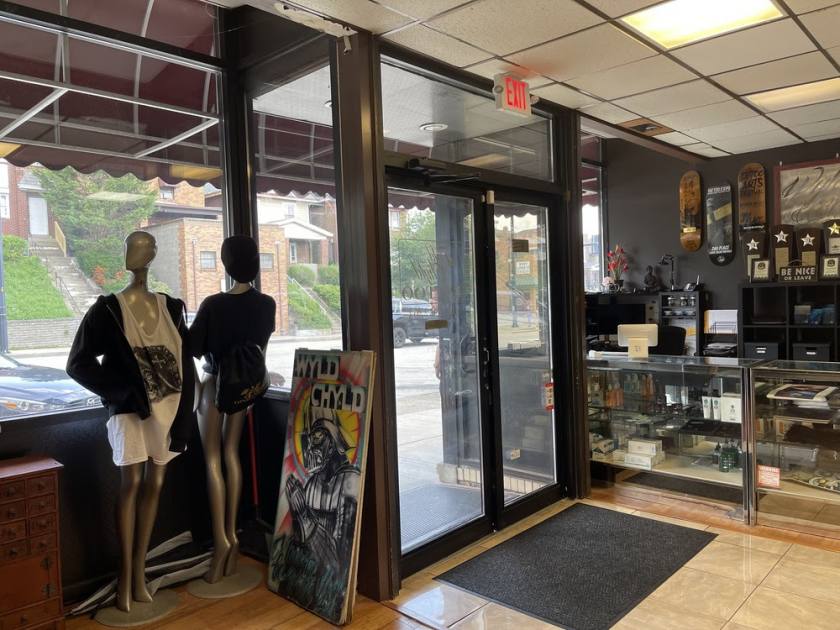
Open space perfect for retail operation or offices in The Ritz Apartments building.
central air, 2 restrooms, kitchenette
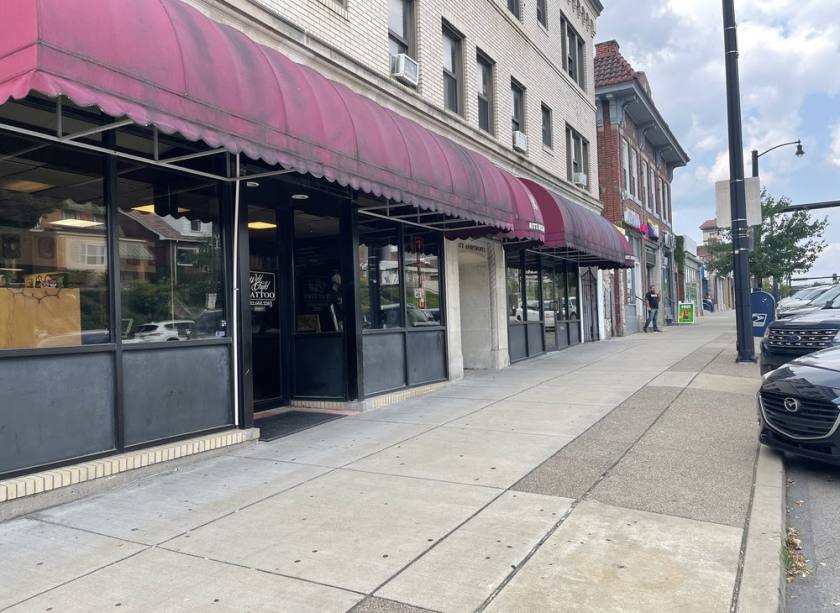
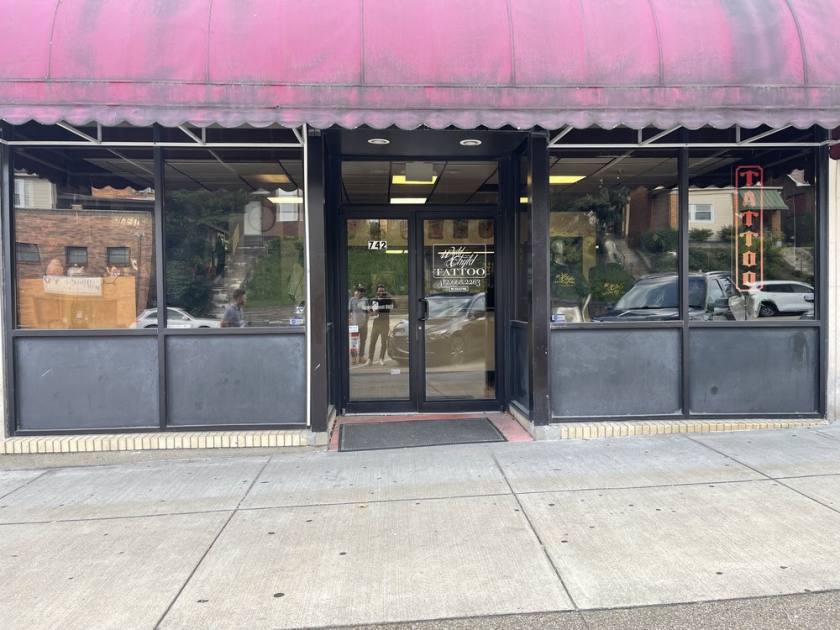
Glass storefront. awnings. Highly visible in vibrant, safe, walkable business district
total population within 1-3 miles: 23K-161K, average age 38-40, average HH income 55K-64K
Brookline Blvd is a true, wide blvd in the thriving neighborhood of Brookline, in the South Hills Location is mid-blvd.
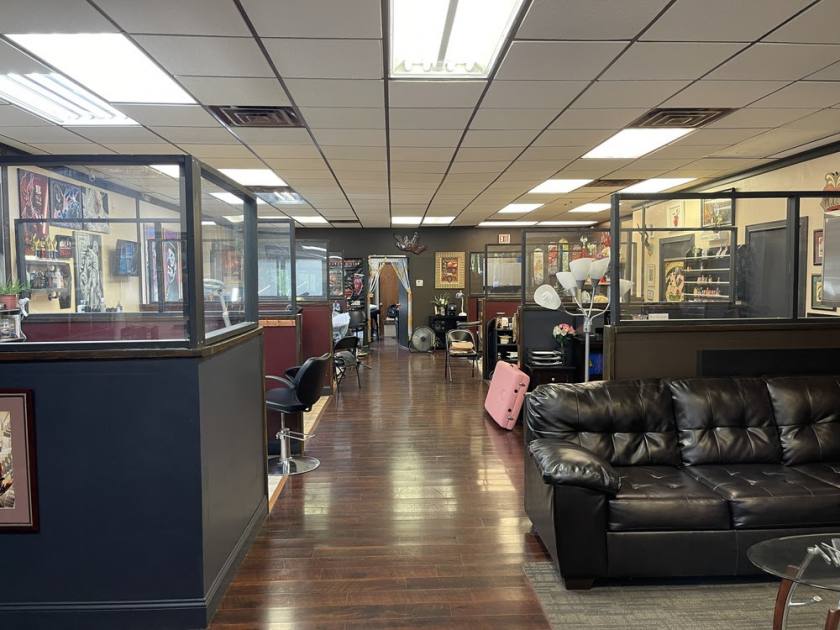
former long term tattoo shop and former furniture store. perfect for Doctor/Dentist practice.
Open space perfect for retail operation or offices in The Ritz Apartments building.
Central air, 2 restrooms, kitchenette. Glass frontage with awning. Newer facade. This is located in the middle of Brookline business district with high walking traffic, and close to many restaurants, bars, salons, medical practices, CVS, bakeries, courtroom, banquet halls, groceries/shopping and other small businesses.
Plenty of on street parking. Located in 8,883 sq. ft commercial building and adjacent to county magistrate offices- fabulous visibility.
Brookline is a vibrant, thriving, walkable community located in the south hills section of the city of Pittsburgh.
- Population average age between 38-40 and total population within 1 mile is 22, 039. Highly desirable area for young families.
-Brookline is adjacent to the Dormont and Mt. Lebanon neighborhoods of Pittsburgh, among others, so population ( and potential customers/clients/patients is 160,943 within only 3 miles of the retail space)
-Average income ranging from 54k-64k.
- Brookline Blvd intersects with 2 high traffic routes- Pioneer Avenue and West Liberty Ave (Rt.19 S.) which are major arteries for anyone travelling from downtown Pittsburgh to anywhere in the South Hills. Public transit is widely available.
Lease duration is negotiable- minimum 3 years
No part of this information may be copied, reproduced, repurposed, or screen-captured for any commercial purpose without prior written authorization from MyEListing.
While we strive to provide the most accurate information, all listing information, and demographic data, is provided by third-parties. As such, MyEListing will not be responsible for the accuracy of the information. It is strongly recommended that you verify all information with the listing agent, and any relevant agencies, prior to making any decisions.
What is the building size of this commercial Retail property?
The size of this lease property at '.742 Brookline Boulevard.' is 2500 square feet
What kind of Retail is the propery at 742 Brookline Boulevard?
The property at 742 Brookline Boulevard Pittsburgh, PA 15226 is listed as a Free Standing Building Retail property
What is the population within 1 mile of 742 Brookline Boulevard in Pittsburgh?
The population within 1 mile of 742 Brookline Boulevard Pittsburgh, PA 15226 is 20,681 people.
Who do I contact for questions about 742 Brookline Boulevard?
You should contact the listing agent,
tamam mansour, for any details regarding this commercial listing.