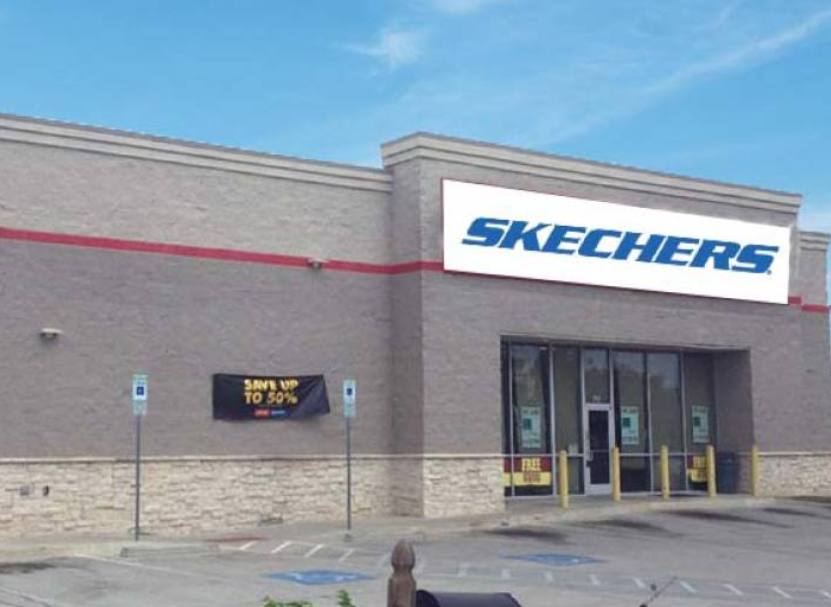
1-Mile | 3-Miles | 5-Miles | ||
---|---|---|---|---|
Total Population | 19,464 | 142,288 | 324,546 | |
Population Median Age | 32 | 34 | 35 | |
Population by Age | 0-9 Yrs | 3388 (17%) | 21477 (15%) | 44774 (13%) |
10-19 Yrs | 2449 (12%) | 22495 (15%) | 48437 (14%) | |
20-29 Yrs | 3895 (20%) | 26041 (18%) | 55599 (17%) | |
30-39 Yrs | 2993 (15%) | 19914 (13%) | 44751 (13%) | |
40-49 Yrs | 2233 (11%) | 17003 (11%) | 41883 (12%) | |
50-59 Yrs | 2174 (11%) | 14499 (10%) | 37255 (11%) | |
60-69 Yrs | 1321 (6%) | 10878 (7%) | 28829 (8%) | |
70+ Yrs | 1011 (5%) | 9981 (7%) | 23020 (7%) | |
Median HH Income | $42,393 | $49,055 | $59,080 | |
Total Household Income | < 24K | 1960 (29%) | 11662 (24%) | 20285 (18%) |
25-49K | 1644 (24%) | 12363 (26%) | 26719 (23%) | |
50-74K | 1261 (18%) | 9543 (20%) | 23015 (20%) | |
75-99K | 677 (10%) | 5748 (12%) | 14961 (13%) | |
100-199K | 918 (13%) | 6985 (14%) | 22631 (20%) | |
200K+ | 212 (3%) | 1133 (2%) | 4667 (4%) | |
Highest Education Level | No Diploma | 2706 | 19244 | 34260 |
Diploma or GED | 3203 | 23289 | 50293 | |
Some College | 2316 | 18126 | 46863 | |
Assoc. Degree | 699 | 5389 | 15313 | |
Bachelors Degree | 1873 | 13190 | 38466 | |
Higher Degree | 1065 | 5698 | 18717 | |
Total Housing Units | 7,569 | 52,521 | 122,643 | |
--Owner-Occupied | 2,224 | 20,153 | 57,016 | |
--Renter-Occupied | 4,447 | 27,280 | 55,262 | |
Owner-Occupied Values | < 100K | 421 | 4411 | 7213 |
100-199K | 1329 | 10674 | 28301 | |
200-299K | 386 | 3656 | 15565 | |
300-399K | 86 | 952 | 3933 | |
400-499K | 0 | 179 | 1116 | |
500K+ | 1 | 279 | 888 | |
Total Working Age Population | 14,528 | 108,187 | 252,028 | |
In Work Force | 10,254 | 71,589 | 174,104 | |
Not In Work Force | 4,274 | 36,598 | 77,924 | |
Workforce Employed | 9,494 | 67,352 | 165,299 | |
Workforce Unemployed | 759 | 4,174 | 8,639 | |
Civlian Workforce | 10,254 | 71,525 | 173,939 | |
Military Workforce | 0 | 64 | 165 | |
Total Households | 6,671 | 47,433 | 112,278 | |
Family Households | 4,359 | 31,028 | 75,292 | |
Non-Family Households | 2,312 | 16,405 | 36,986 | |
Married Couple | 2,796 | 19,791 | 49,783 | |
Other Family | 1,563 | 11,237 | 25,509 | |
Married w/Child | 1,329 | 9,028 | 21,589 | |
Single Male w/Child | 173 | 1,425 | 2,999 | |
Single Female w/Child | 788 | 4,798 | 10,499 |
Population Change Last Two Decades - Plus Projection
2000 | % | 2010 | % | 2020 | % | 2030 | |
---|---|---|---|---|---|---|---|
Texas | 20,851,820 | +21 | 25,145,561 | +18 | 29,677,668 | +18 | 34,894,452 |
Tarrant County | 1,446,219 | +25 | 1,809,034 | +19 | 2,143,755 | +17 | 2,507,170 |
Dallas County | 2,218,899 | +7 | 2,368,139 | +15 | 2,734,111 | +14 | 3,106,298 |
Total Working Age Population:
Total Households:
Total Working Age Population:
Total Households:
Total Working Age Population:
Total Households: