Specialty Real Estate
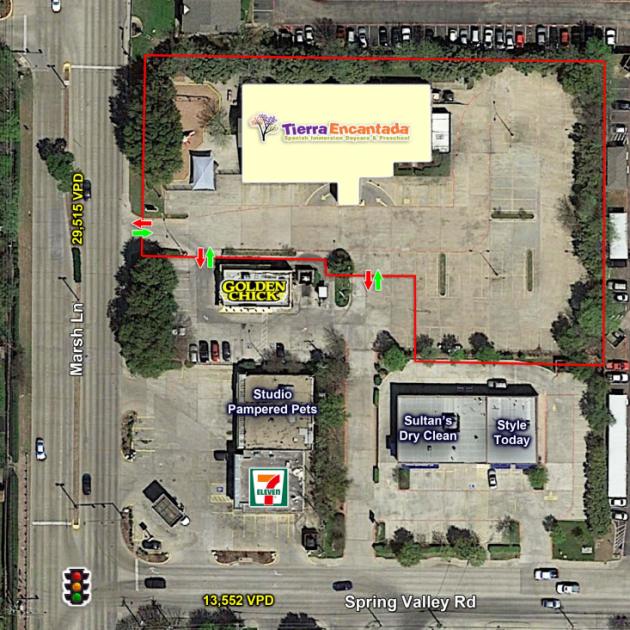
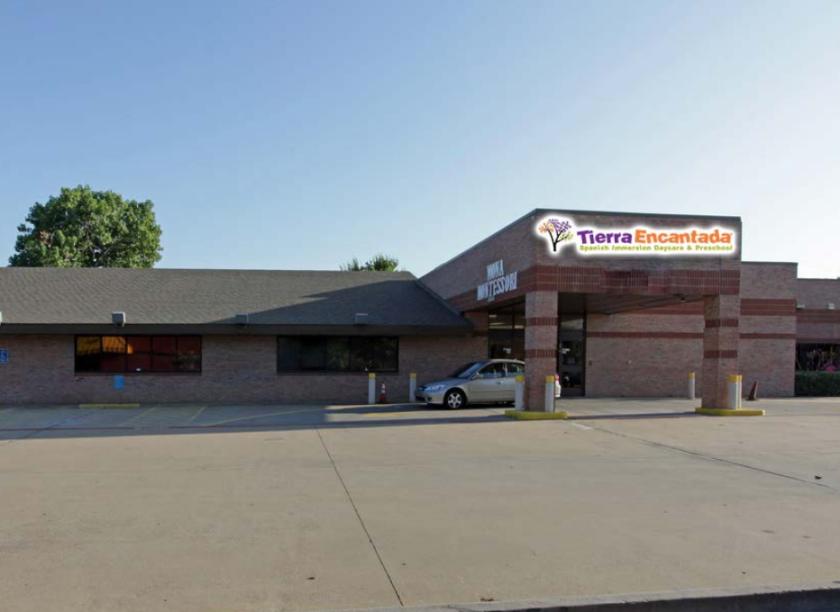
14450 Marsh Lane Addison, TX 75001
14450 Marsh Lane Addison, TX 75001
Details & Description
Property Highlights
- • 100% Leased
- • 2nd Generation Preschool
- • Fenced in Playground
Listing Agents

Chris Flesner
O: 469-386-8987
chris@resolutre.com
O: 469-386-8987
chris@resolutre.com
While we strive to provide the most accurate information, all listing information, and demographic data, is provided by third-parties. As such, MyEListing will not be responsible for the accuracy of the information. It is strongly recommended that you verify all information with the listing agent, and any relevant agencies, prior to making any decisions.