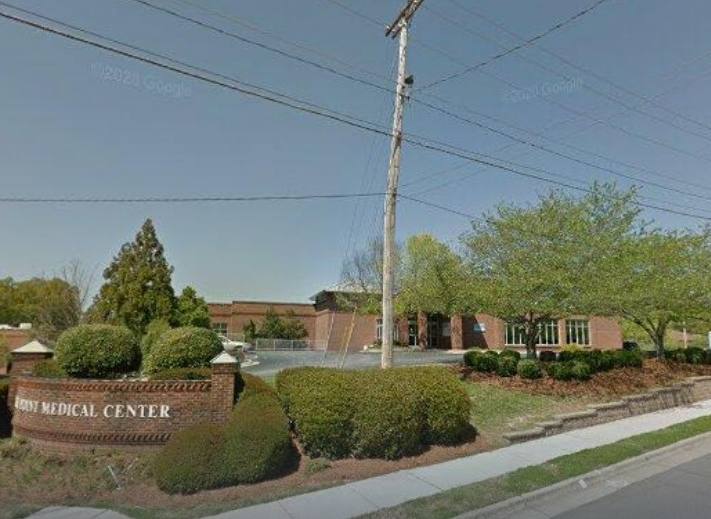
Office Space
624 Quaker Lane High Point, NC 27262
624 Quaker Lane High Point, NC 27262
Details & Description
Property Highlights
- • Therapy Pool with submerged treadmill
- • Locker room style changing and restrooms
- • Handicap Showers
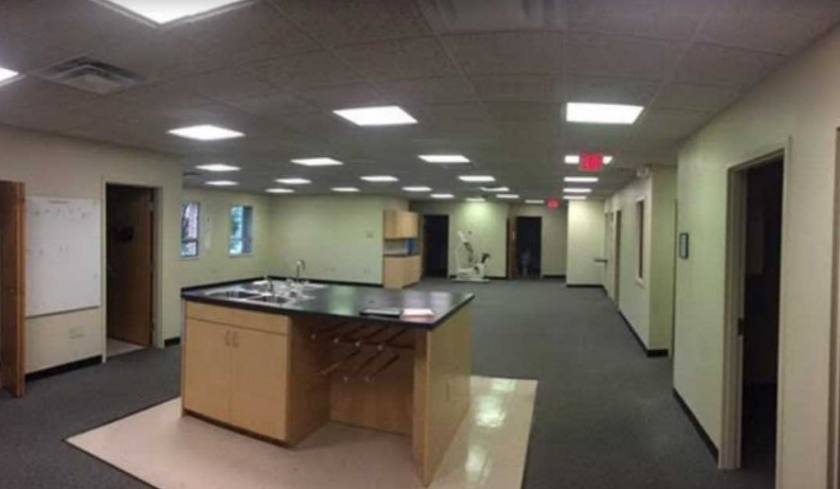
- • Multiple exam rooms and offices
- • Reception area
- • Open Gym Area
Listing Agents

Mark Lindsay
O: 336-878-5171
M: 336-692-5612
LindsayRealEstateHoldings@gmail.com
O: 336-878-5171
M: 336-692-5612
LindsayRealEstateHoldings@gmail.com
While we strive to provide the most accurate information, all listing information, and demographic data, is provided by third-parties. As such, MyEListing will not be responsible for the accuracy of the information. It is strongly recommended that you verify all information with the listing agent, and any relevant agencies, prior to making any decisions.