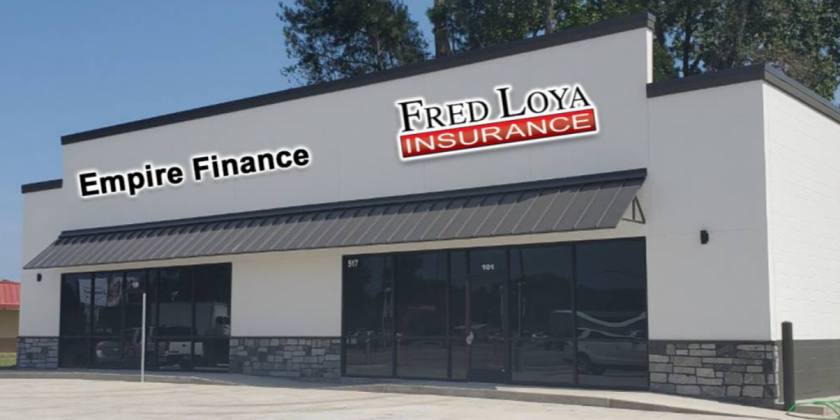
1-Mile | 3-Miles | 5-Miles | ||
---|---|---|---|---|
Total Population | 1,969 | 10,552 | 18,861 | |
Population Median Age | 42 | 35 | 34 | |
Population by Age | 0-9 Yrs | 201 (10%) | 1682 (15%) | 3223 (17%) |
10-19 Yrs | 290 (14%) | 1723 (16%) | 3021 (16%) | |
20-29 Yrs | 229 (11%) | 1511 (14%) | 2679 (14%) | |
30-39 Yrs | 132 (6%) | 1184 (11%) | 2370 (12%) | |
40-49 Yrs | 236 (11%) | 1151 (10%) | 2122 (11%) | |
50-59 Yrs | 259 (13%) | 1309 (12%) | 2309 (12%) | |
60-69 Yrs | 417 (21%) | 1132 (10%) | 1758 (9%) | |
70+ Yrs | 206 (10%) | 859 (8%) | 1377 (7%) | |
Median HH Income | $46,546 | $39,831 | $40,324 | |
Total Household Income | < 24K | 176 (24%) | 1022 (29%) | 1631 (27%) |
25-49K | 197 (27%) | 1112 (32%) | 2040 (33%) | |
50-74K | 122 (17%) | 555 (16%) | 978 (16%) | |
75-99K | 59 (8%) | 289 (8%) | 560 (9%) | |
100-199K | 137 (19%) | 407 (11%) | 701 (11%) | |
200K+ | 22 (3%) | 66 (1%) | 108 (1%) | |
Highest Education Level | No Diploma | 269 | 1720 | 2892 |
Diploma or GED | 352 | 2363 | 4371 | |
Some College | 290 | 1508 | 2531 | |
Assoc. Degree | 49 | 248 | 678 | |
Bachelors Degree | 179 | 449 | 750 | |
Higher Degree | 176 | 262 | 348 | |
Total Housing Units | 792 | 3,834 | 6,797 | |
--Owner-Occupied | 525 | 2,110 | 3,895 | |
--Renter-Occupied | 187 | 1,340 | 2,123 | |
Owner-Occupied Values | < 100K | 261 | 1155 | 1912 |
100-199K | 99 | 611 | 1280 | |
200-299K | 22 | 142 | 321 | |
300-399K | 142 | 174 | 284 | |
400-499K | 0 | 0 | 8 | |
500K+ | 1 | 27 | 90 | |
Total Working Age Population | 1,635 | 7,977 | 13,817 | |
In Work Force | 808 | 4,311 | 7,686 | |
Not In Work Force | 826 | 3,666 | 6,130 | |
Workforce Employed | 761 | 3,930 | 7,041 | |
Workforce Unemployed | 47 | 381 | 645 | |
Civlian Workforce | 808 | 4,311 | 7,686 | |
Military Workforce | 0 | 0 | 0 | |
Total Households | 713 | 3,450 | 6,018 | |
Family Households | 584 | 2,426 | 4,264 | |
Non-Family Households | 128 | 1,024 | 1,755 | |
Married Couple | 422 | 1,658 | 3,014 | |
Other Family | 162 | 768 | 1,249 | |
Married w/Child | 97 | 699 | 1,391 | |
Single Male w/Child | 6 | 66 | 150 | |
Single Female w/Child | 56 | 404 | 588 |
Population Change Last Two Decades - Plus Projection
2000 | % | 2010 | % | 2020 | % | 2030 | |
---|---|---|---|---|---|---|---|
Texas | 20,851,820 | +21 | 25,145,561 | +18 | 29,677,668 | +18 | 34,894,452 |
San Jacinto County | 22,246 | +19 | 26,384 | +9 | 28,844 | +7 | 30,940 |
Montgomery County | 293,768 | +55 | 455,746 | +35 | 613,951 | +35 | 831,450 |
Liberty County | 70,154 | +8 | 75,643 | +13 | 85,284 | +12 | 95,433 |
Total Working Age Population:
Total Households:
Total Working Age Population:
Total Households:
Total Working Age Population:
Total Households: