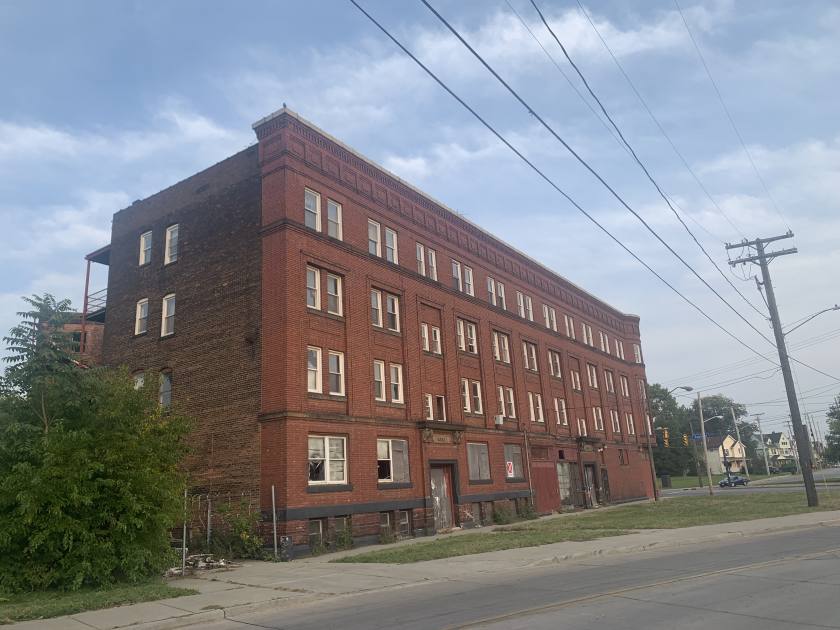
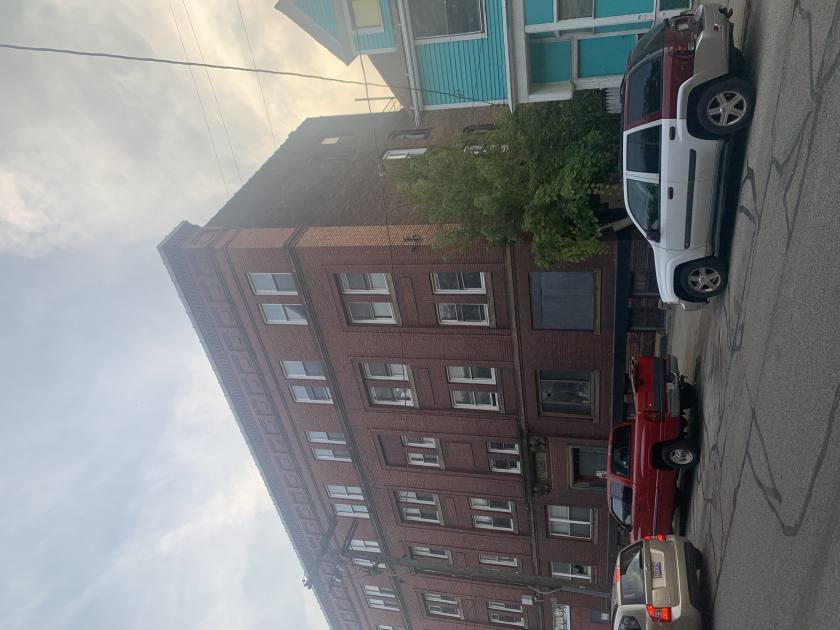
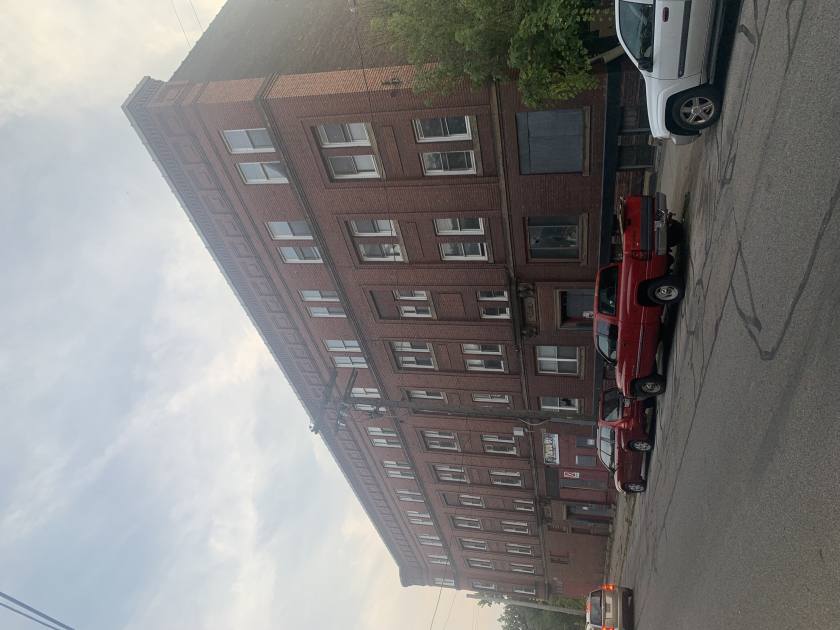
Multifamily Housing
7049 Superior Avenue Cleveland, OH 44103
7049 Superior Avenue Cleveland, OH 44103

Details & Description
Property Highlights
- • 36 unit building
- • 26 two bed room apartments
- • 6 three bed room apartments
- • 4 store front, retail, or office spaces on bottom
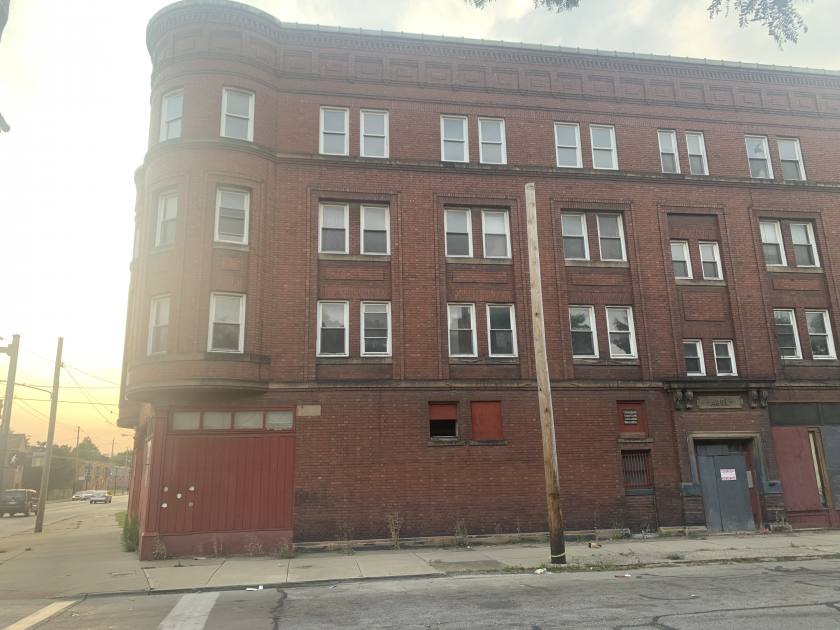
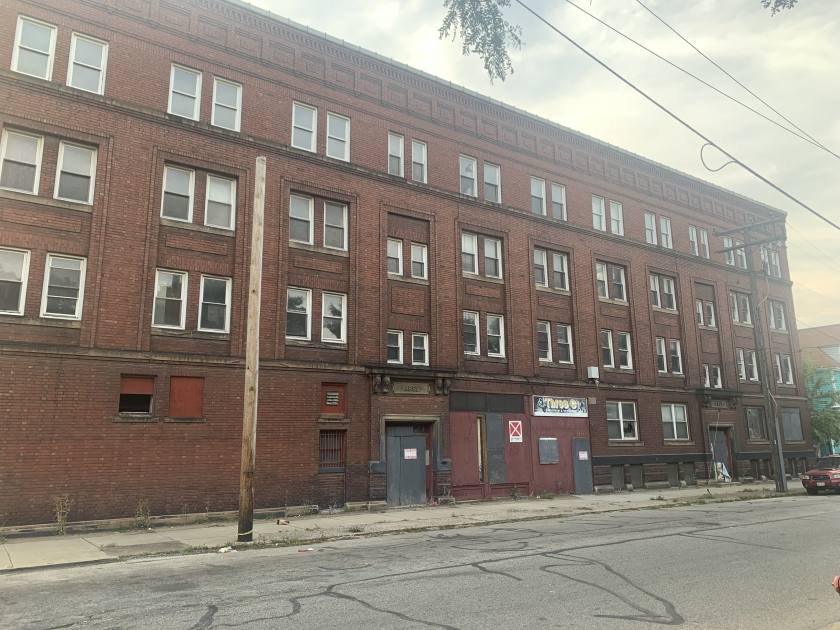
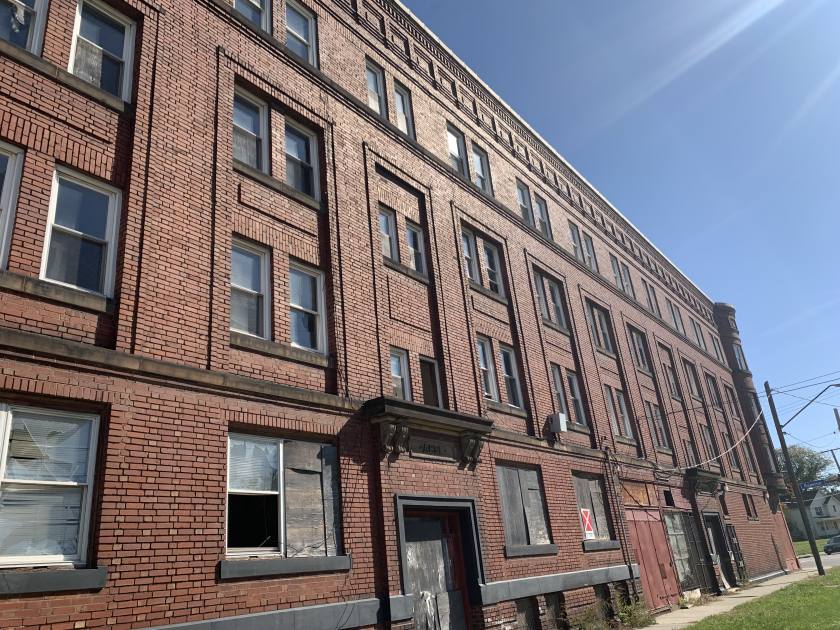
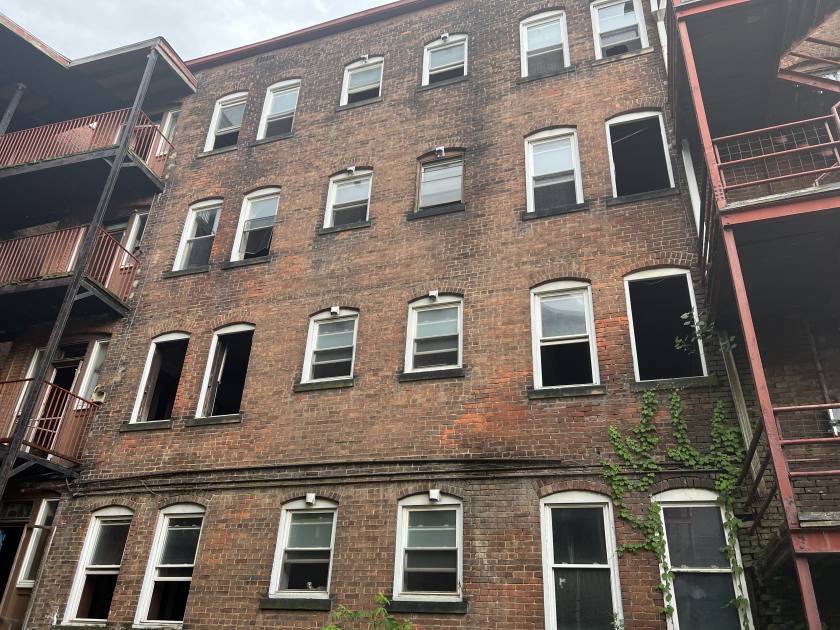
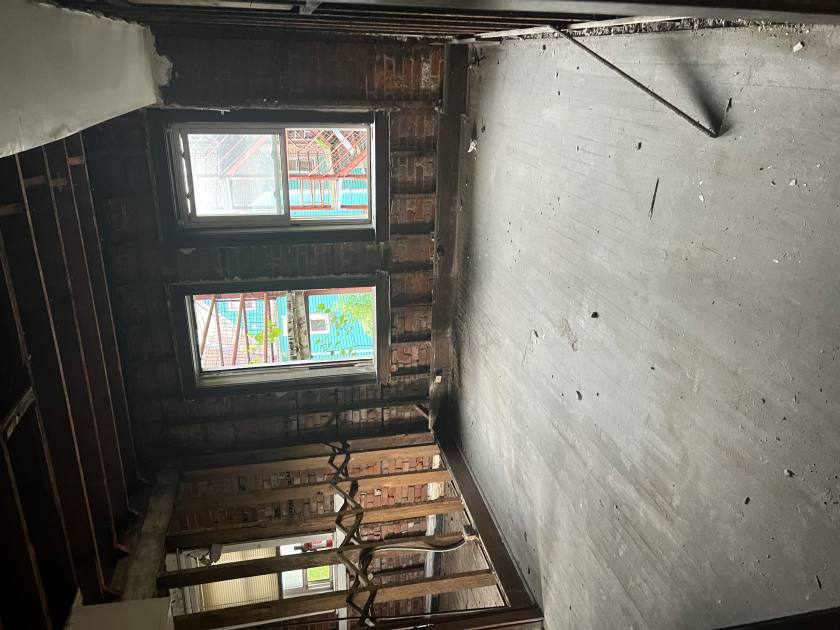
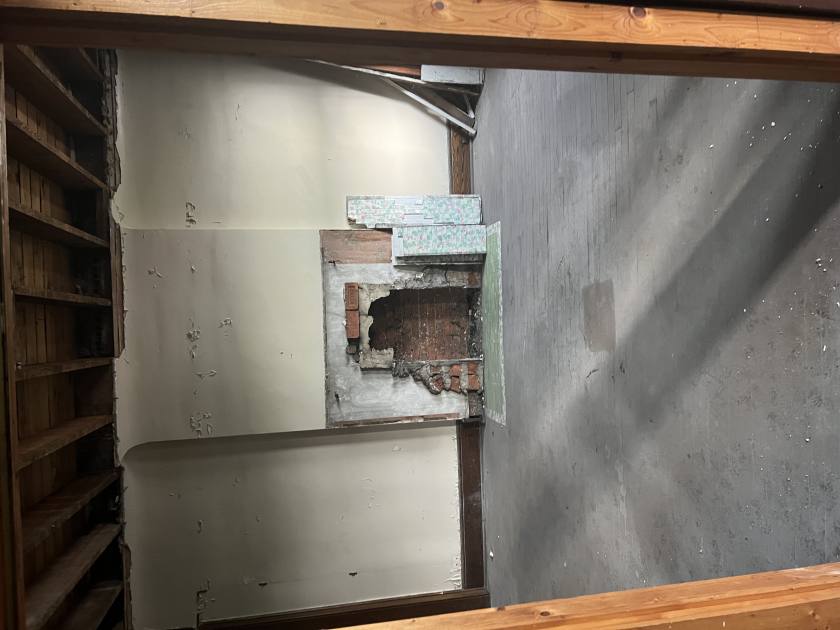
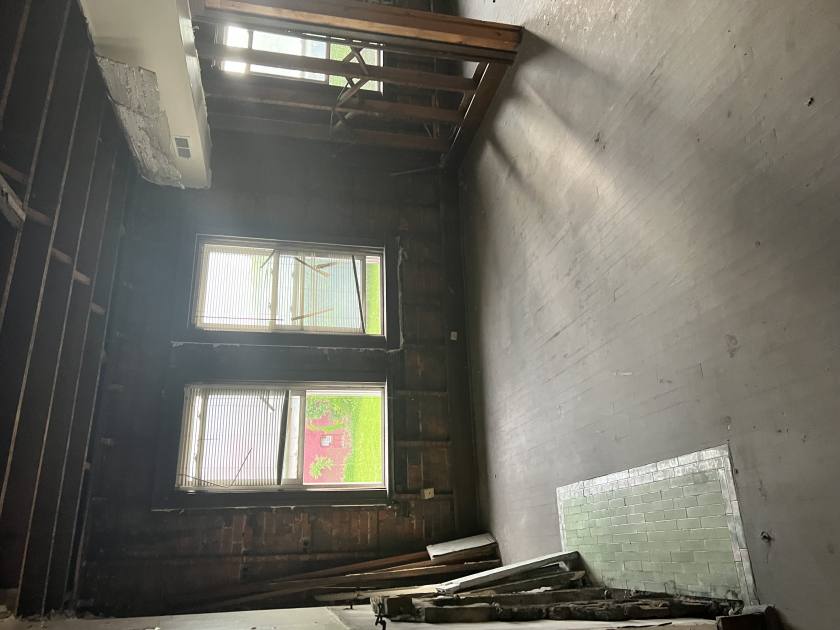
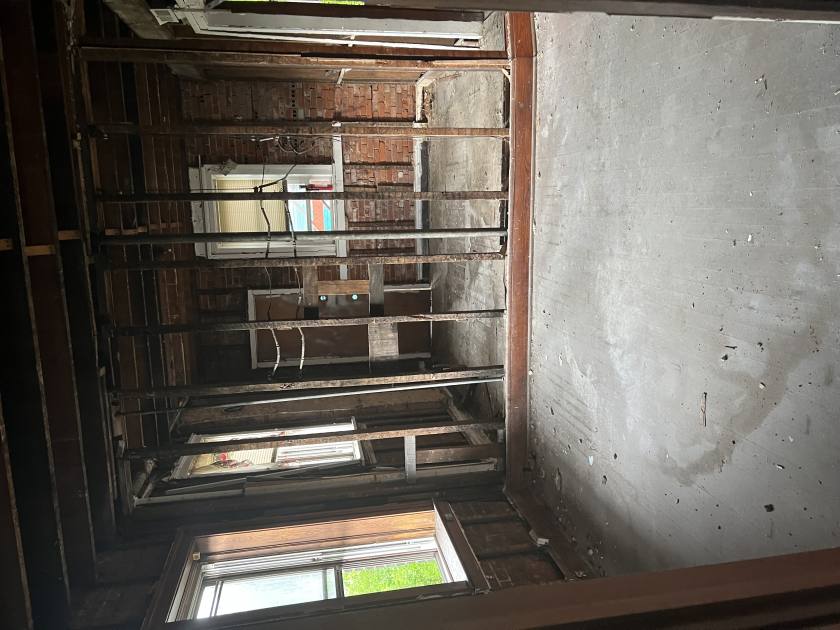
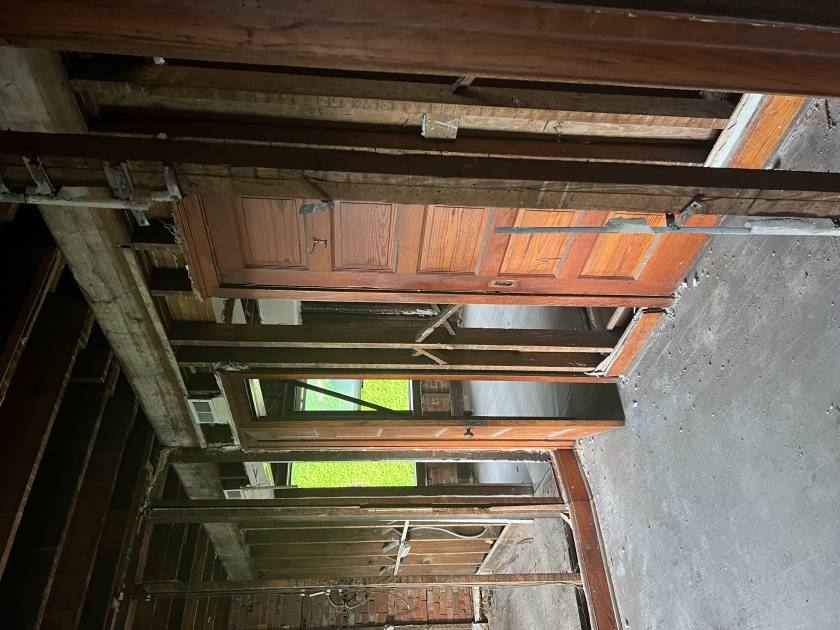
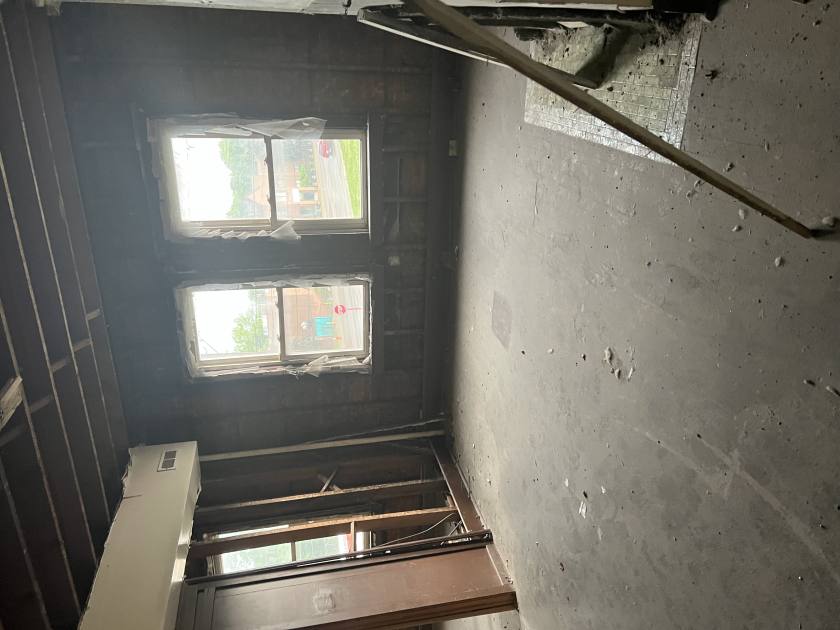
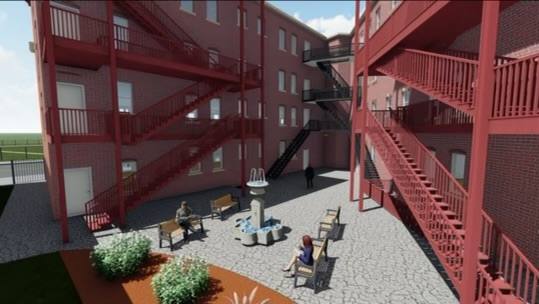
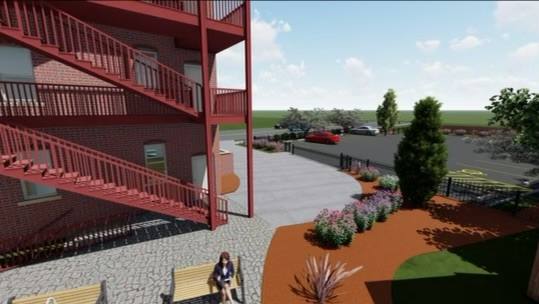
Additional Photos


Listing Agents

Carlia Wilkinson
O: 440-835-8300
wilkinsoncarlia@gmail.com
O: 440-835-8300
wilkinsoncarlia@gmail.com
While we strive to provide the most accurate information, all listing information, and demographic data, is provided by third-parties. As such, MyEListing will not be responsible for the accuracy of the information. It is strongly recommended that you verify all information with the listing agent, and any relevant agencies, prior to making any decisions.