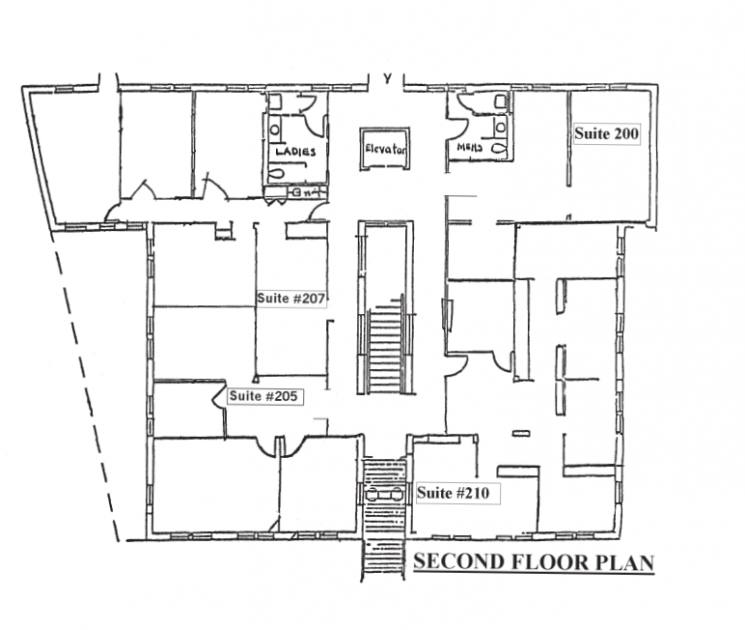
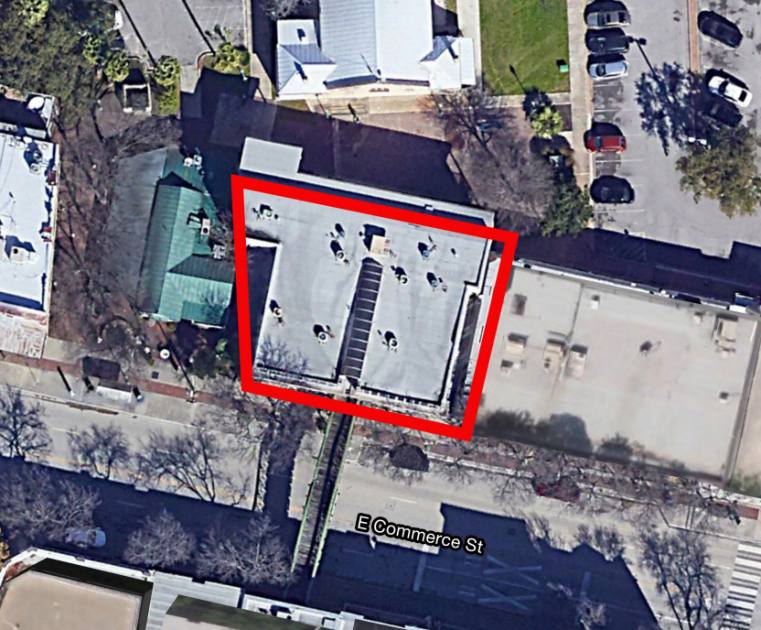
Office Space
1145 East Commerce Street San Antonio, TX 78205
1145 East Commerce Street San Antonio, TX 78205

Details & Description
Property Highlights
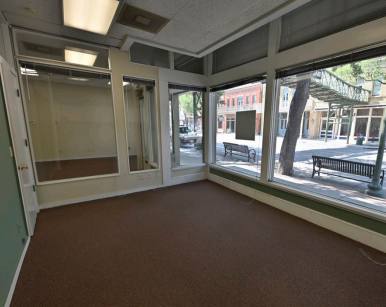
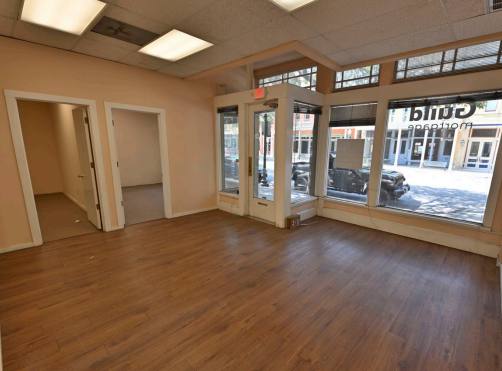
- • Great visibility
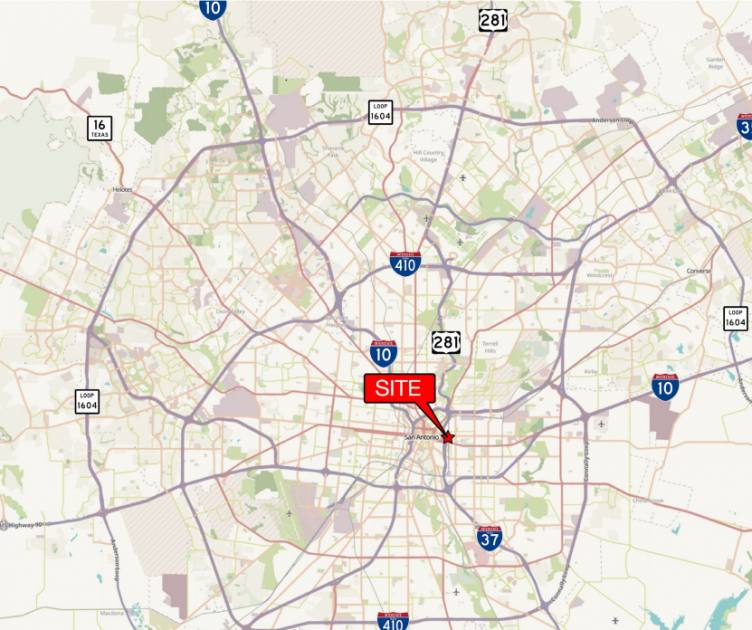
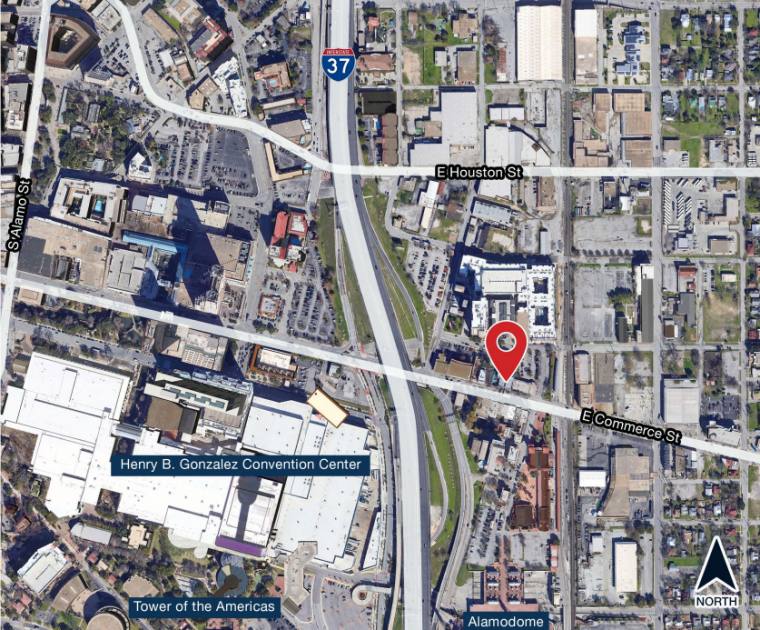
- • Accessible to downtown and the airport
- • Easy ingress and egress to IH 37 and Downtown CBD
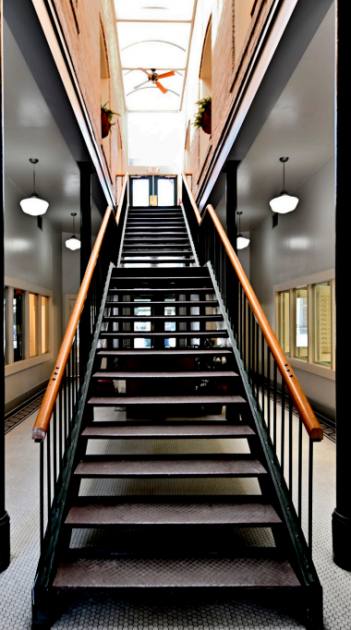
- • Landmark property
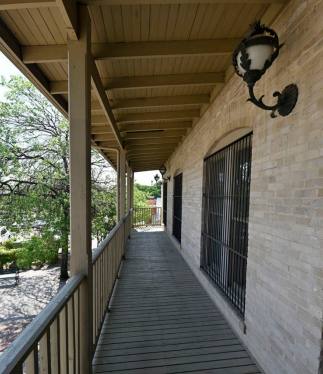
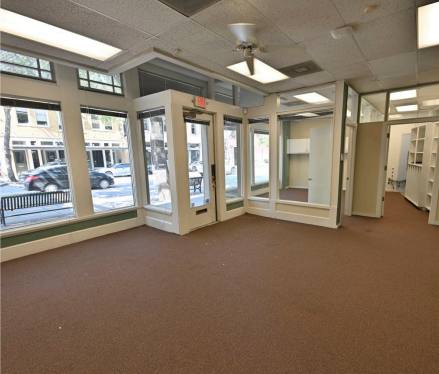
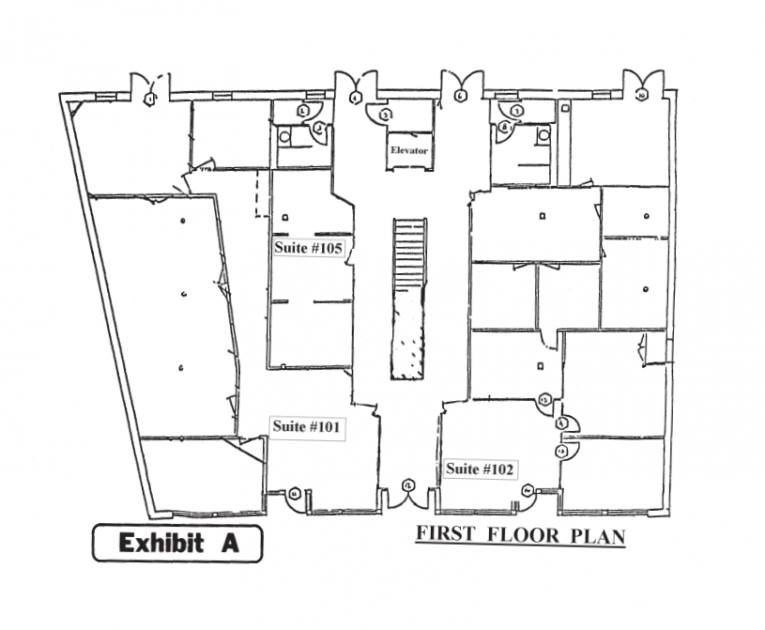
- • Interior recently renovated
- • Backs up to multifamily and residential properties
Additional Photos
Listing Agents

Michael Morse
O: 210-524-4000
M: 210-524-1312
mmorse@reocsanantonio.com
O: 210-524-4000
M: 210-524-1312
mmorse@reocsanantonio.com
While we strive to provide the most accurate information, all listing information, and demographic data, is provided by third-parties. As such, MyEListing will not be responsible for the accuracy of the information. It is strongly recommended that you verify all information with the listing agent, and any relevant agencies, prior to making any decisions.