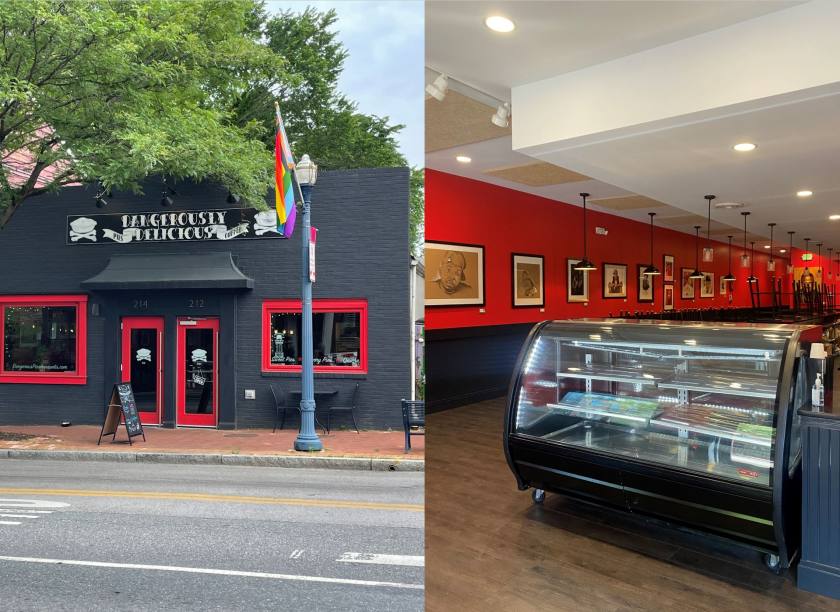
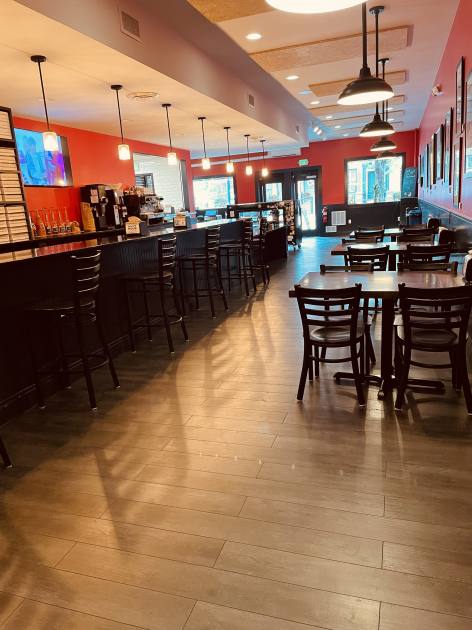
Retail Space
212 West Street Annapolis, MD 21401
212 West Street Annapolis, MD 21401
Details & Description
Property Highlights
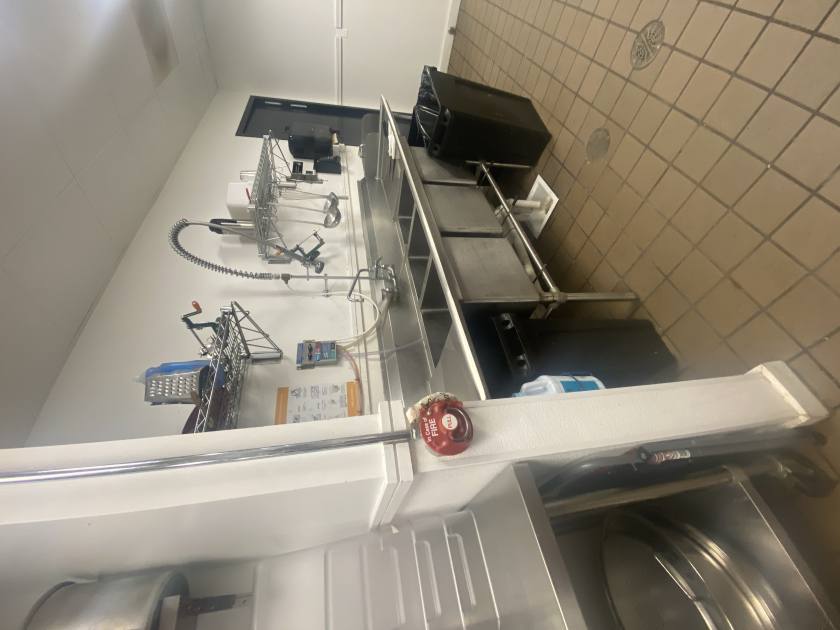
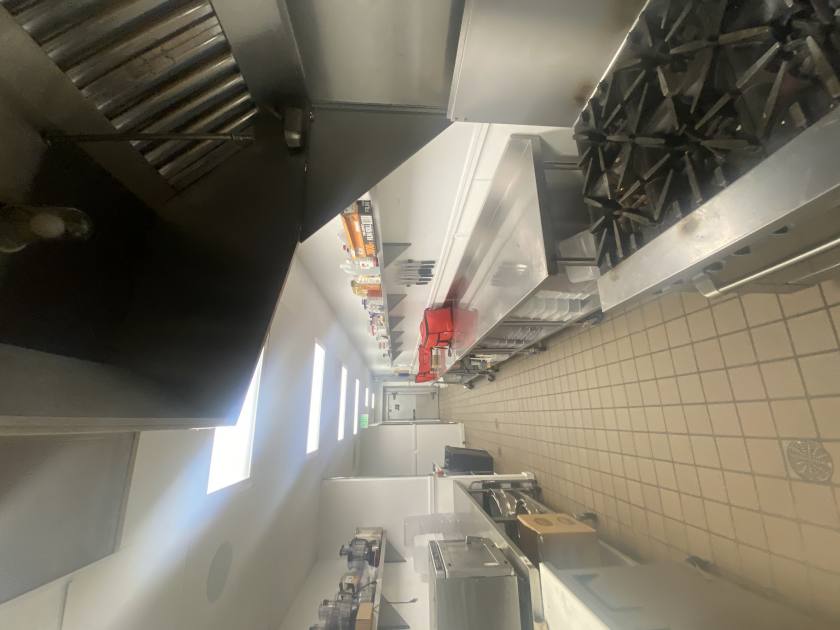
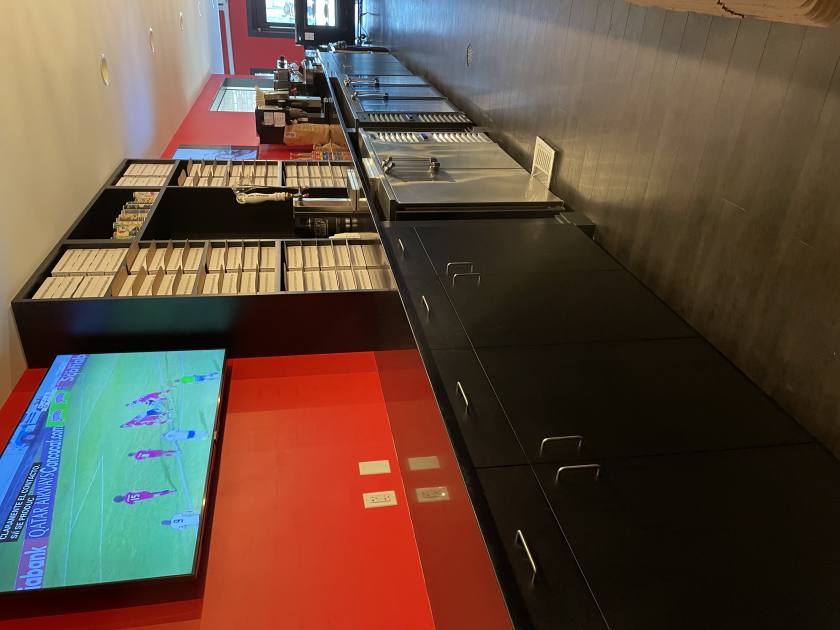
- • 2700 SF Turn-Key Restaurant
- • Wine and Beer License
- • Walkable West Street Location
- • All renovations Completed Between 2019-2022
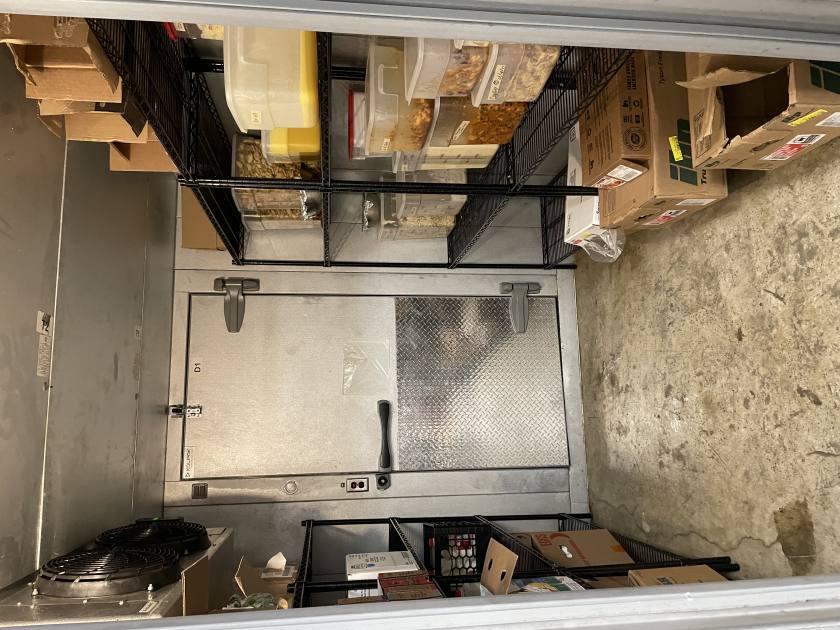
- • Walk-in Refrigerator & Freezer
- • New HVAC 2020
Additional Photos

Listing Agents

Treva Ghattas
O: 410-266-1113
treva@murphycre.com
O: 410-266-1113
treva@murphycre.com
While we strive to provide the most accurate information, all listing information, and demographic data, is provided by third-parties. As such, MyEListing will not be responsible for the accuracy of the information. It is strongly recommended that you verify all information with the listing agent, and any relevant agencies, prior to making any decisions.