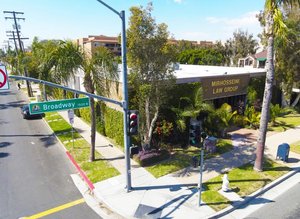
1-Mile | 3-Miles | 5-Miles | ||
---|---|---|---|---|
Total Population | 40,161 | 293,363 | 670,647 | |
Population Median Age | 35 | 34 | 36 | |
Population by Age | 0-9 Yrs | 4784 (11%) | 40245 (13%) | 85655 (12%) |
10-19 Yrs | 6206 (15%) | 42952 (14%) | 90050 (13%) | |
20-29 Yrs | 7597 (18%) | 51518 (17%) | 114806 (17%) | |
30-39 Yrs | 5413 (13%) | 47383 (16%) | 103145 (15%) | |
40-49 Yrs | 4978 (12%) | 37899 (12%) | 88324 (13%) | |
50-59 Yrs | 5233 (13%) | 33948 (11%) | 81681 (12%) | |
60-69 Yrs | 3517 (8%) | 21870 (7%) | 57406 (8%) | |
70+ Yrs | 2432 (6%) | 17547 (5%) | 49579 (7%) | |
Median HH Income | $84,339 | $72,036 | $82,102 | |
Total Household Income | < 24K | 838 (10%) | 9618 (13%) | 25469 (13%) |
25-49K | 1293 (15%) | 14580 (19%) | 31324 (16%) | |
50-74K | 1402 (17%) | 13932 (19%) | 32071 (16%) | |
75-99K | 1437 (17%) | 10578 (14%) | 27338 (14%) | |
100-199K | 2792 (34%) | 19882 (27%) | 57093 (29%) | |
200K+ | 378 (4%) | 4496 (6%) | 19969 (10%) | |
Highest Education Level | No Diploma | 11367 | 69561 | 110744 |
Diploma or GED | 6330 | 40650 | 85619 | |
Some College | 3821 | 31544 | 80502 | |
Assoc. Degree | 1310 | 9233 | 27984 | |
Bachelors Degree | 1955 | 25296 | 92031 | |
Higher Degree | 512 | 10633 | 45289 | |
Total Housing Units | 8,300 | 75,620 | 201,501 | |
--Owner-Occupied | 4,909 | 29,381 | 87,490 | |
--Renter-Occupied | 3,232 | 43,704 | 105,775 | |
Owner-Occupied Values | < 100K | 159 | 1694 | 4390 |
100-199K | 51 | 632 | 1272 | |
200-299K | 181 | 1870 | 2847 | |
300-399K | 666 | 3458 | 6554 | |
400-499K | 1366 | 5781 | 11166 | |
500K+ | 2486 | 15946 | 61262 | |
Total Working Age Population | 31,790 | 227,306 | 532,171 | |
In Work Force | 21,658 | 155,577 | 358,359 | |
Not In Work Force | 10,132 | 71,729 | 173,812 | |
Workforce Employed | 20,732 | 147,409 | 340,654 | |
Workforce Unemployed | 915 | 7,895 | 17,300 | |
Civlian Workforce | 21,647 | 155,304 | 357,954 | |
Military Workforce | 12 | 273 | 405 | |
Total Households | 8,141 | 73,084 | 193,265 | |
Family Households | 7,197 | 56,447 | 138,313 | |
Non-Family Households | 943 | 16,638 | 54,952 | |
Married Couple | 4,805 | 38,369 | 98,541 | |
Other Family | 2,392 | 18,078 | 39,772 | |
Married w/Child | 2,152 | 18,745 | 46,324 | |
Single Male w/Child | 202 | 1,983 | 5,008 | |
Single Female w/Child | 514 | 5,680 | 11,578 |
Population Change Last Two Decades - Plus Projection
2000 | % | 2010 | % | 2020 | % | 2030 | |
---|---|---|---|---|---|---|---|
California | 33,871,648 | +10 | 37,253,956 | +9 | 40,467,295 | +8 | 43,631,295 |
Orange County | 2,846,289 | +6 | 3,010,232 | +8 | 3,257,087 | +5 | 3,431,096 |
Total Working Age Population:
Total Households:
Total Working Age Population:
Total Households:
Total Working Age Population:
Total Households: