Office Space
400 12th Avenue North St Petersburg, FL 33701
400 12th Avenue North St Petersburg, FL 33701

Details & Description
Property Highlights
- • 2,150 sq ft professional office.
- • Unit adjacent and Facing Fourth Street North.
- • Built out with exam rooms and shielded X-ray room.
- • Ample parking on-site.
- • Signage opportunities available.
- • Traffic Count: 26,000 AADT.
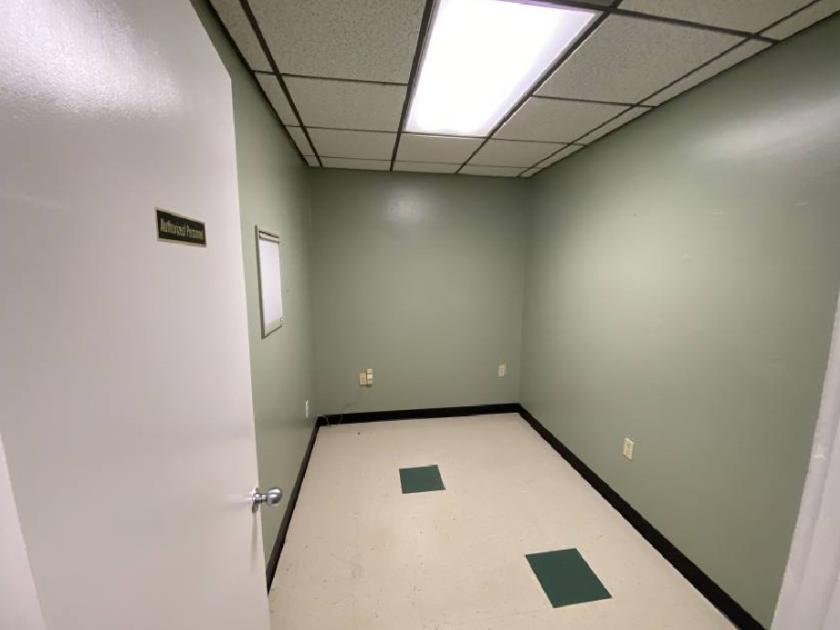
Additional Photos


Listing Agents

Kevin Yeager
O: 727-822-4715
M: 727-214-4590
kevin@cprteam.com
O: 727-822-4715
M: 727-214-4590
kevin@cprteam.com
While we strive to provide the most accurate information, all listing information, and demographic data, is provided by third-parties. As such, MyEListing will not be responsible for the accuracy of the information. It is strongly recommended that you verify all information with the listing agent, and any relevant agencies, prior to making any decisions.


