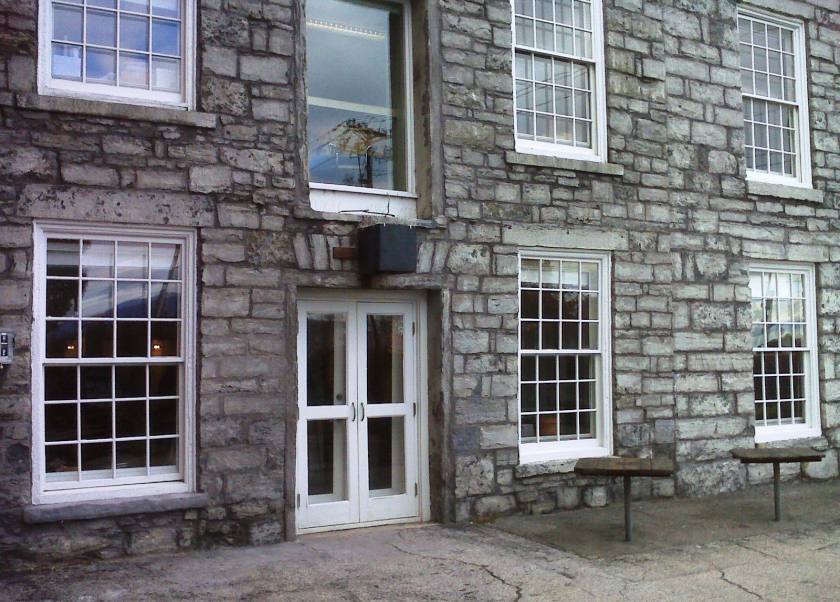
1-Mile | 3-Miles | 5-Miles | ||
---|---|---|---|---|
Total Population | 16,954 | 56,361 | 84,460 | |
Population Median Age | 33 | 35 | 36 | |
Population by Age | 0-9 Yrs | 975 (5%) | 4009 (7%) | 7098 (8%) |
10-19 Yrs | 1614 (9%) | 8616 (15%) | 12271 (14%) | |
20-29 Yrs | 7530 (44%) | 17630 (31%) | 21766 (25%) | |
30-39 Yrs | 2297 (13%) | 7494 (13%) | 10727 (12%) | |
40-49 Yrs | 1118 (6%) | 4660 (8%) | 8332 (9%) | |
50-59 Yrs | 1198 (7%) | 4970 (8%) | 8527 (10%) | |
60-69 Yrs | 1271 (7%) | 4511 (8%) | 7945 (9%) | |
70+ Yrs | 953 (5%) | 4472 (7%) | 7792 (9%) | |
Median HH Income | $47,351 | $57,685 | $62,917 | |
Total Household Income | < 24K | 2303 (31%) | 5633 (24%) | 7057 (20%) |
25-49K | 1455 (19%) | 4519 (19%) | 6676 (19%) | |
50-74K | 1072 (14%) | 3751 (16%) | 5542 (16%) | |
75-99K | 921 (12%) | 3027 (13%) | 4616 (13%) | |
100-199K | 1088 (14%) | 4423 (19%) | 7188 (21%) | |
200K+ | 453 (6%) | 1390 (6%) | 2568 (7%) | |
Highest Education Level | No Diploma | 690 | 2215 | 3679 |
Diploma or GED | 1337 | 5528 | 9014 | |
Some College | 1087 | 4599 | 7454 | |
Assoc. Degree | 498 | 2254 | 4304 | |
Bachelors Degree | 3219 | 10666 | 16044 | |
Higher Degree | 2092 | 6840 | 10648 | |
Total Housing Units | 7,648 | 23,618 | 35,225 | |
--Owner-Occupied | 1,679 | 8,724 | 15,964 | |
--Renter-Occupied | 5,613 | 14,018 | 17,682 | |
Owner-Occupied Values | < 100K | 24 | 337 | 740 |
100-199K | 205 | 1222 | 2145 | |
200-299K | 394 | 3083 | 5183 | |
300-399K | 372 | 1860 | 3745 | |
400-499K | 149 | 999 | 1962 | |
500K+ | 536 | 1223 | 2189 | |
Total Working Age Population | 15,630 | 50,212 | 73,382 | |
In Work Force | 10,823 | 33,434 | 49,297 | |
Not In Work Force | 4,807 | 16,778 | 24,085 | |
Workforce Employed | 10,275 | 31,978 | 47,212 | |
Workforce Unemployed | 521 | 1,387 | 1,968 | |
Civlian Workforce | 10,796 | 33,365 | 49,180 | |
Military Workforce | 27 | 68 | 117 | |
Total Households | 7,292 | 22,743 | 33,646 | |
Family Households | 1,936 | 8,940 | 15,522 | |
Non-Family Households | 5,356 | 13,803 | 18,124 | |
Married Couple | 1,398 | 6,522 | 11,617 | |
Other Family | 538 | 2,418 | 3,905 | |
Married w/Child | 492 | 2,407 | 4,258 | |
Single Male w/Child | 73 | 314 | 641 | |
Single Female w/Child | 183 | 892 | 1,418 |
Population Change Last Two Decades - Plus Projection
2000 | % | 2010 | % | 2020 | % | 2030 | |
---|---|---|---|---|---|---|---|
New York | 18,976,457 | +2 | 19,378,102 | +4 | 20,146,131 | +2 | 20,604,030 |
Essex County | 38,851 | +1 | 39,370 | -5 | 37,418 | -3 | 36,175 |
Vermont | 608,827 | +3 | 625,741 | 0 | 628,688 | -1 | 620,480 |
Chittenden County | 146,571 | +7 | 156,545 | +3 | 161,812 | +1 | 162,967 |
Total Working Age Population:
Total Households:
Total Working Age Population:
Total Households:
Total Working Age Population:
Total Households: