Commercial Land
5171 Riggins Rd Hilliard, OH 43016
5171 Riggins Rd Hilliard, OH 43016
Details & Description
Property Highlights
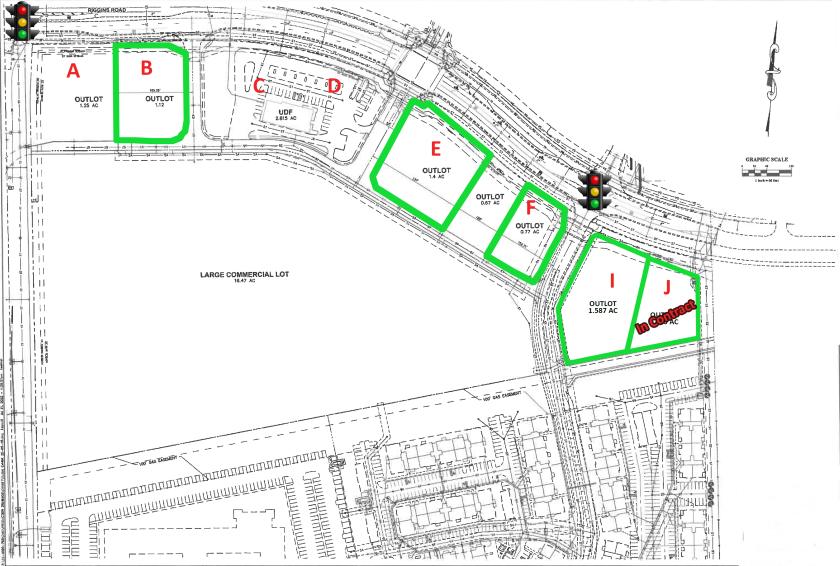
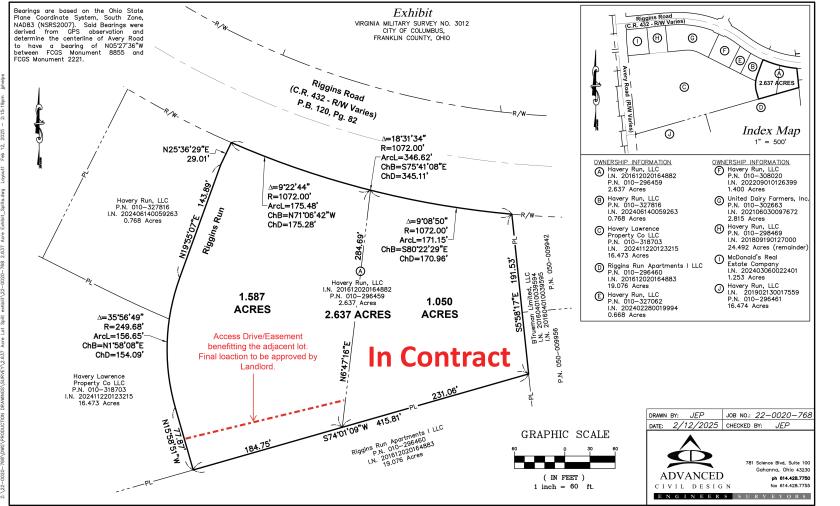
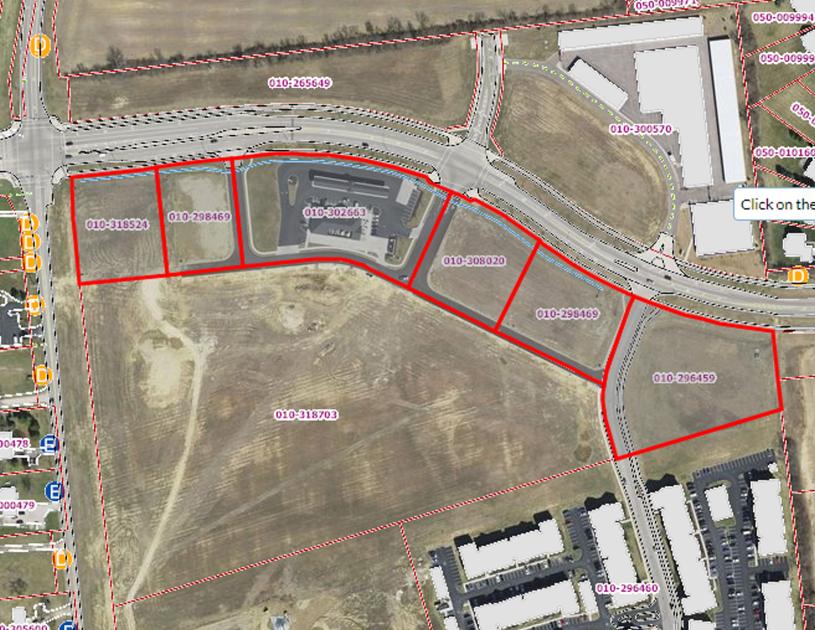
• COMMERCIAL SITES RANGING FROM 0.77 +/- AC TO 1.4 +/- AC
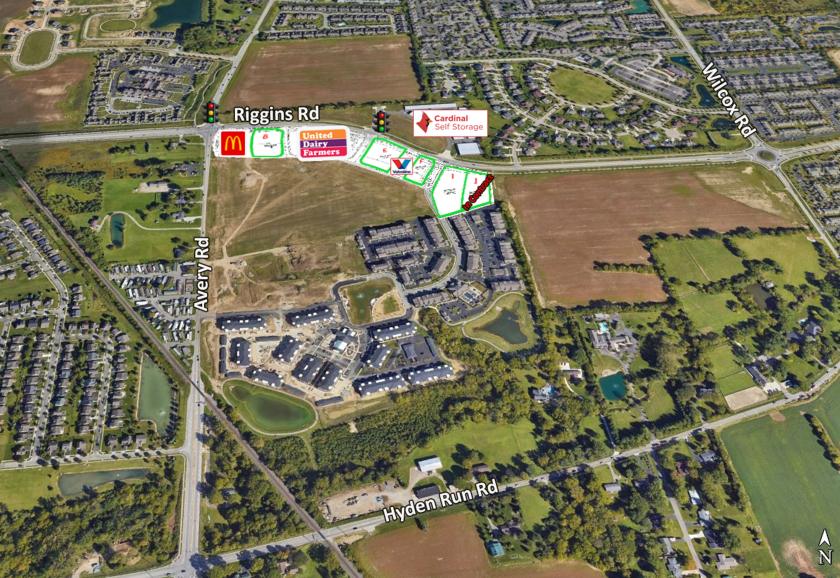
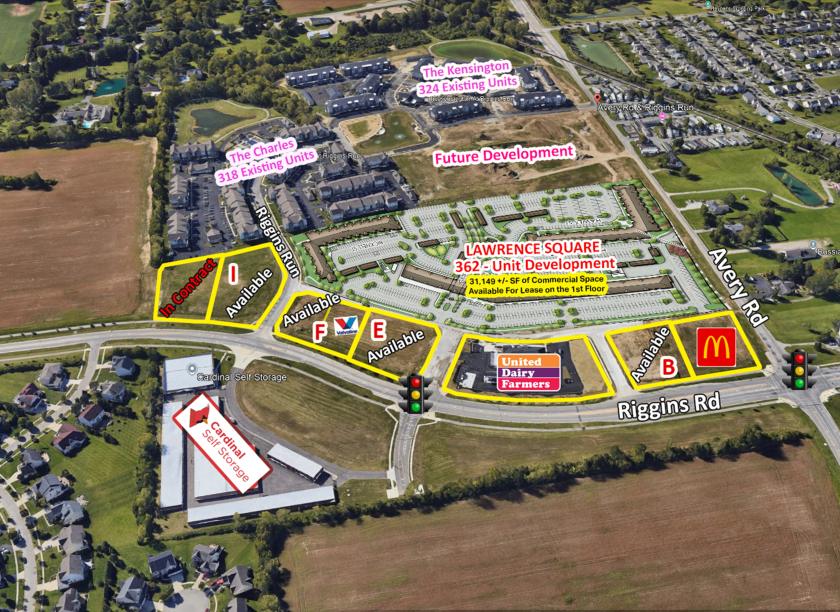
• GREAT OPPORTUNITY FOR COMMERCIAL DEVELOPMENT
Additional Photos


Listing Agents

Skip Weiler
O: 614-221-4286
skip@rweiler.com
O: 614-221-4286
skip@rweiler.com
While we strive to provide the most accurate information, all listing information, and demographic data, is provided by third-parties. As such, MyEListing will not be responsible for the accuracy of the information. It is strongly recommended that you verify all information with the listing agent, and any relevant agencies, prior to making any decisions.