Specialty Real Estate
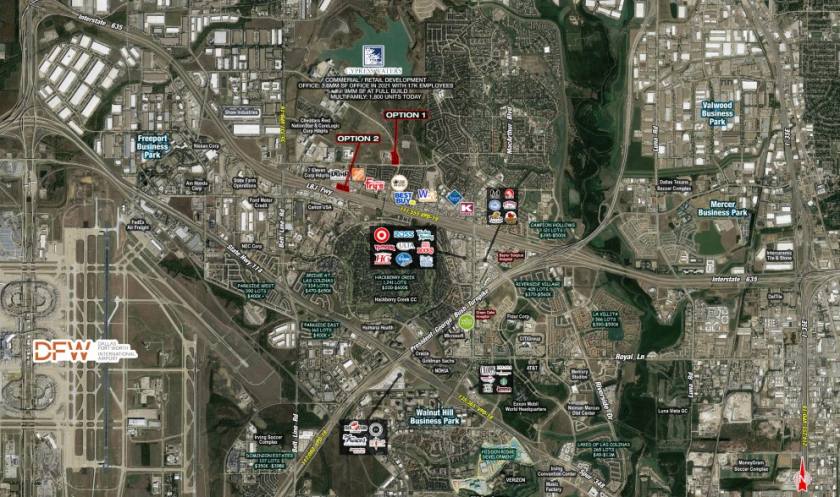
Cypress Waters Irving, TX 75019
Cypress Waters Irving, TX 75019
Details & Description
Property Highlights
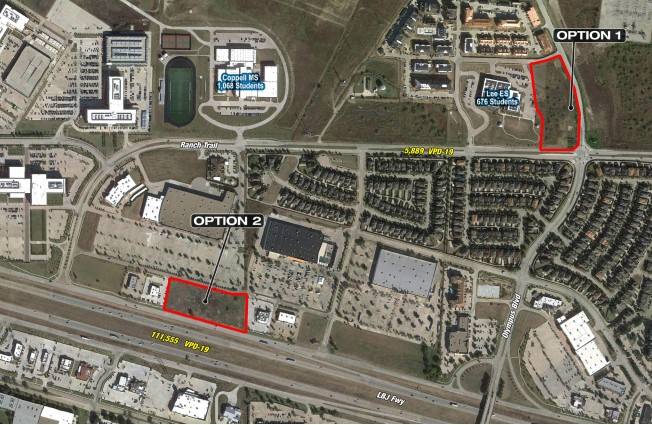
- • BTS Preschool or Daycare
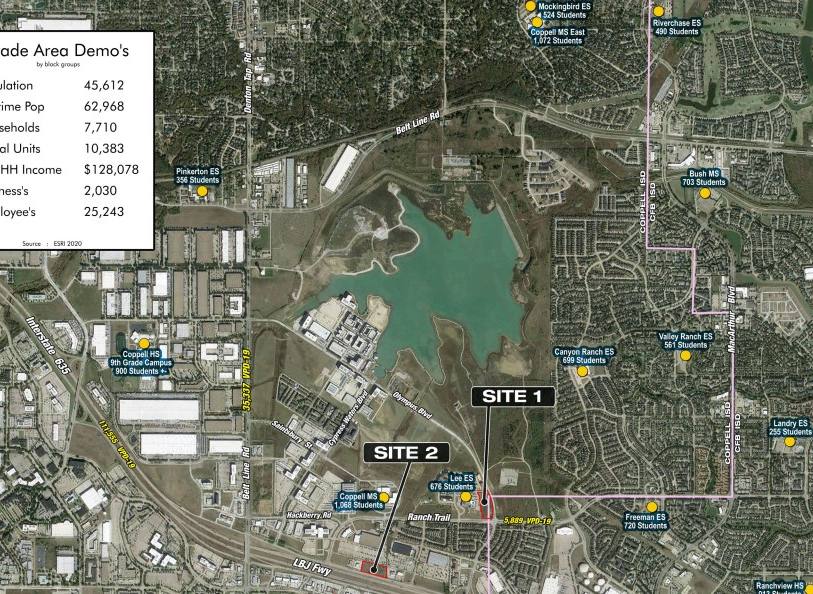
- • Traffic Counts: LBJ Fwy: 111,555 VPD-19
- • Traffic Counts: Ranch Trail: 5,889 VPD-19
Listing Agents

Thomas Glendenning
O: 214-960-4528
M: 214-960-4545
thomas@shopcompanies.com
O: 214-960-4528
M: 214-960-4545
thomas@shopcompanies.com

Jake Sherrington
O: 214-960-4545
M: 214-960-4623
jake@shopcompanies.com
O: 214-960-4545
M: 214-960-4623
jake@shopcompanies.com
While we strive to provide the most accurate information, all listing information, and demographic data, is provided by third-parties. As such, MyEListing will not be responsible for the accuracy of the information. It is strongly recommended that you verify all information with the listing agent, and any relevant agencies, prior to making any decisions.