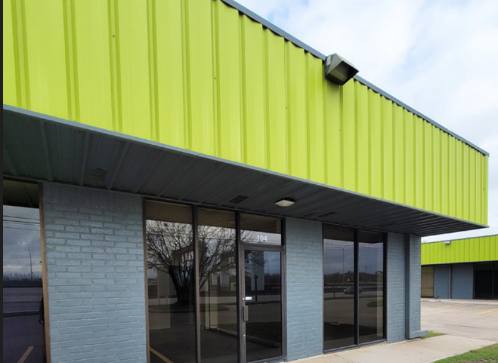
Office Space
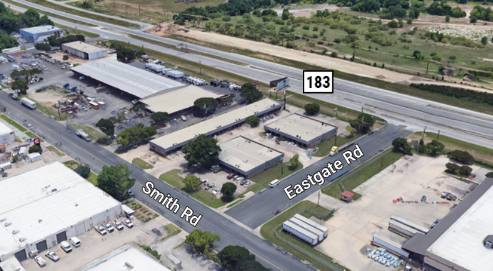
1514 Ed Bluestein Boulevard Austin, TX 78721
1514 Ed Bluestein Boulevard Austin, TX 78721
Details & Description
Property Highlights
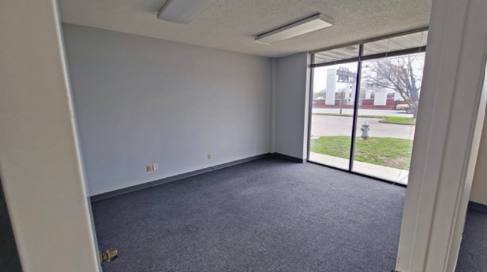
- • Ideal for Office/Retail Use
- • Dropped Ceiling
- • 100% HVAC
Additional Photos
Listing Agents

Jordan McMahon
M: 512-538-0060
jmcmahon@hpitx.com
M: 512-538-0060
jmcmahon@hpitx.com
While we strive to provide the most accurate information, all listing information, and demographic data, is provided by third-parties. As such, MyEListing will not be responsible for the accuracy of the information. It is strongly recommended that you verify all information with the listing agent, and any relevant agencies, prior to making any decisions.


