Retail Space
11721 Ranch Road 620 North Austin, TX 78750
11721 Ranch Road 620 North Austin, TX 78750

Details & Description
Property Highlights
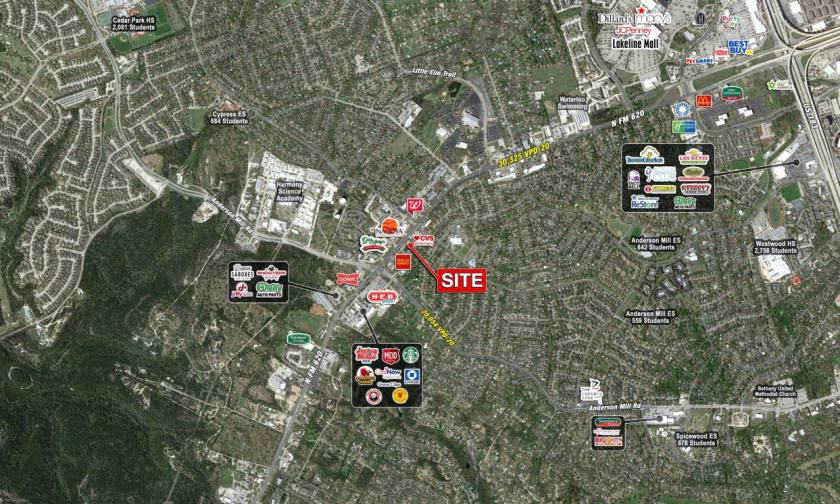
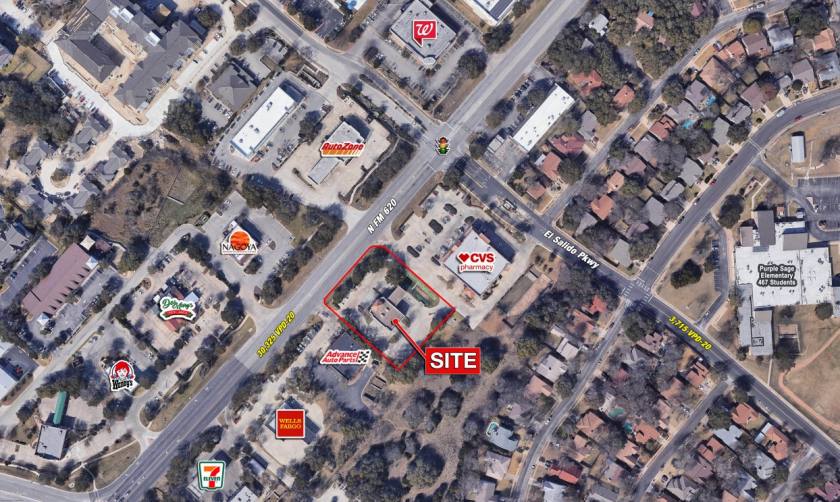
• Traffic Counts: El Salido Pkwy 3,715 VPD-20
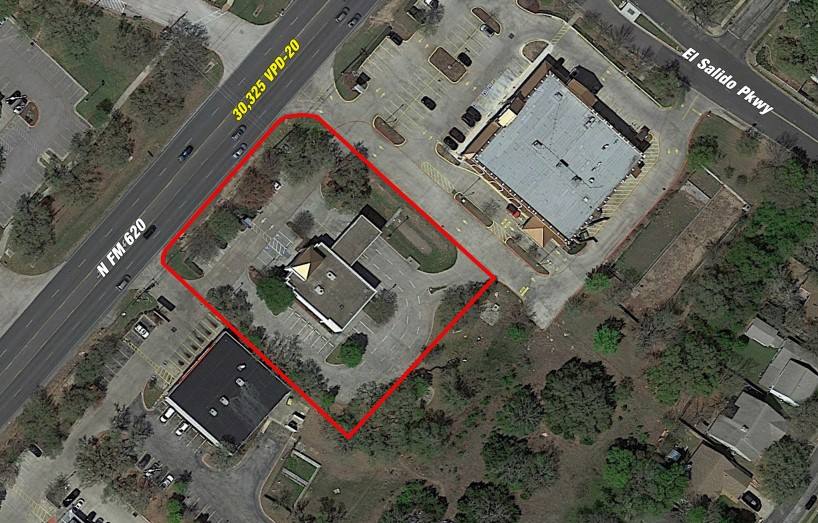
• Traffic Counts: N FM 620 30,325 VPD-20
Additional Photos
Listing Agents

Daniel Frid
O: 214-960-4545
M: 214-501-5108
dfrid@shopcompanies.com
O: 214-960-4545
M: 214-501-5108
dfrid@shopcompanies.com

Jack Weir
O: 214-960-4545
M: 214-935-5634
jack@shopcompanies.com
O: 214-960-4545
M: 214-935-5634
jack@shopcompanies.com
While we strive to provide the most accurate information, all listing information, and demographic data, is provided by third-parties. As such, MyEListing will not be responsible for the accuracy of the information. It is strongly recommended that you verify all information with the listing agent, and any relevant agencies, prior to making any decisions.


