Commercial Land
Hebron Pkwy and Lakepointe Dr Lewisville, TX 75057
Hebron Pkwy and Lakepointe Dr Lewisville, TX 75057

Details & Description
Property Highlights
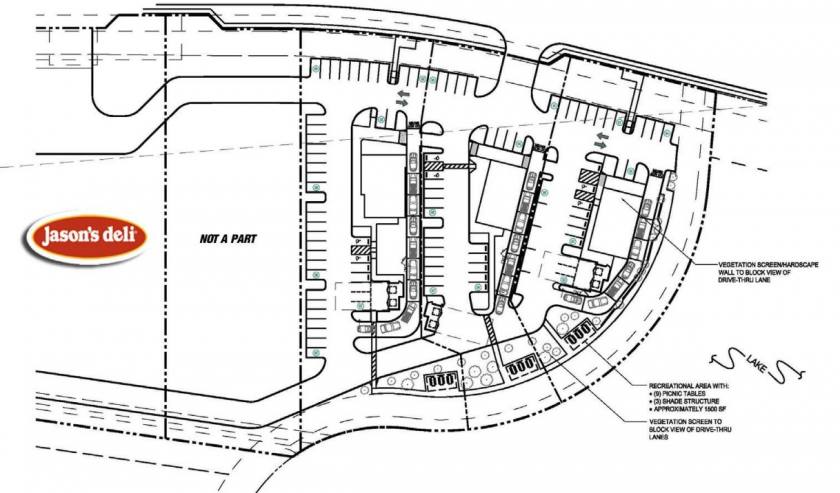
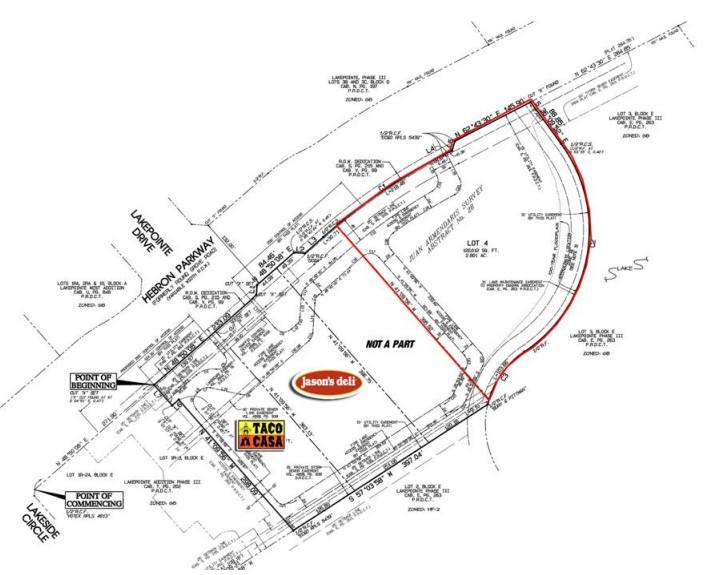
- • Commercial Zoning
- • Cross access to traffic signal
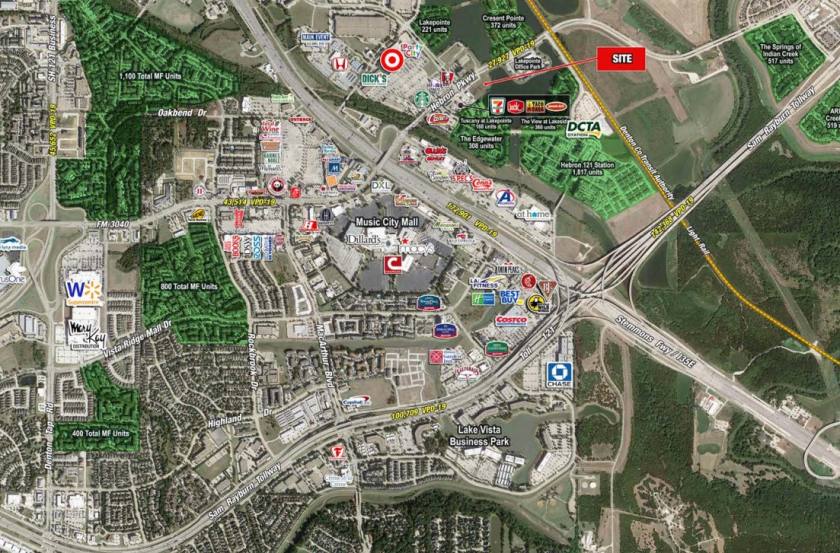
- • Traffic Counts: I-35E: 172,901 VPD (2019)
Additional Photos
Listing Agents

Daniel Frid
O: 214-960-4545
M: 214-501-5108
dfrid@shopcompanies.com
O: 214-960-4545
M: 214-501-5108
dfrid@shopcompanies.com

Jay Ceitlin
O: 214-960-4545
M: 214-960-2856
jay@shopcompanies.com
O: 214-960-4545
M: 214-960-2856
jay@shopcompanies.com
While we strive to provide the most accurate information, all listing information, and demographic data, is provided by third-parties. As such, MyEListing will not be responsible for the accuracy of the information. It is strongly recommended that you verify all information with the listing agent, and any relevant agencies, prior to making any decisions.


